Integrated intelligence for tertiary education
Understand the sector. Inform what comes next.
Explore global markets, compare institutions and examine the choices ahead. CoreBridge Intelligence brings together sector data, organisational analysis and scenario modelling to support decisions across policy, strategy, finance and research.
Open the free dashboards
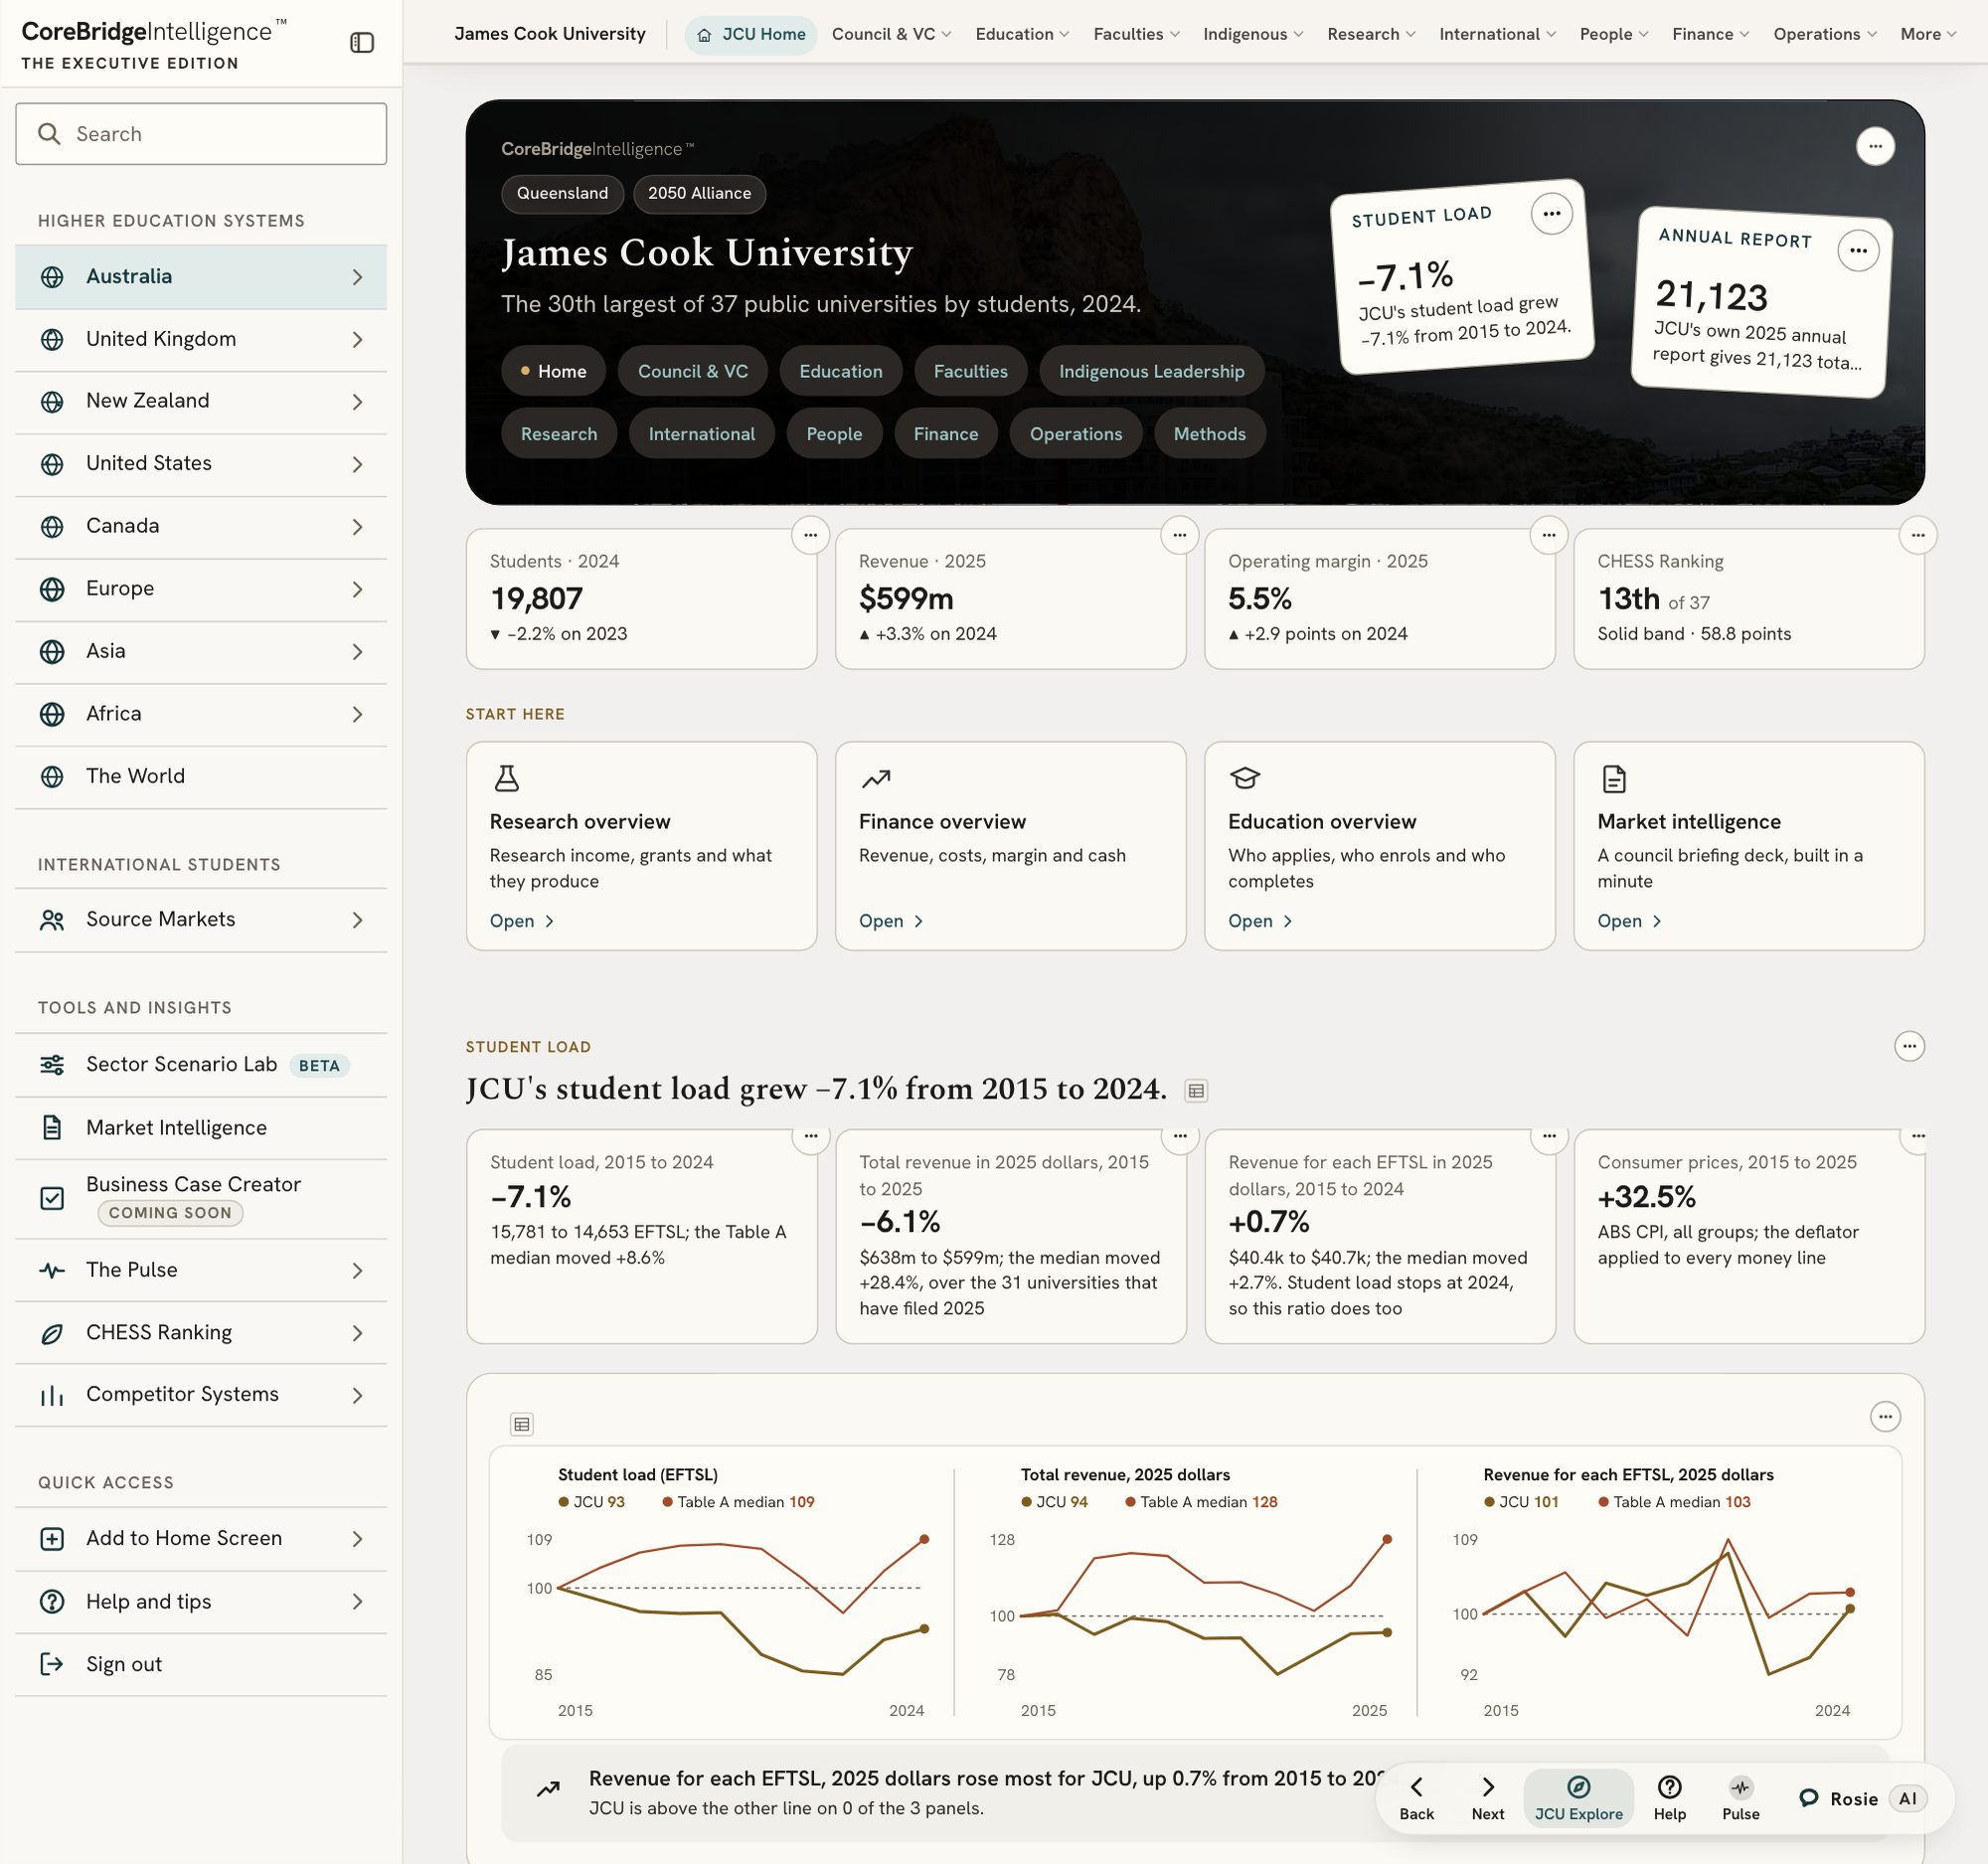
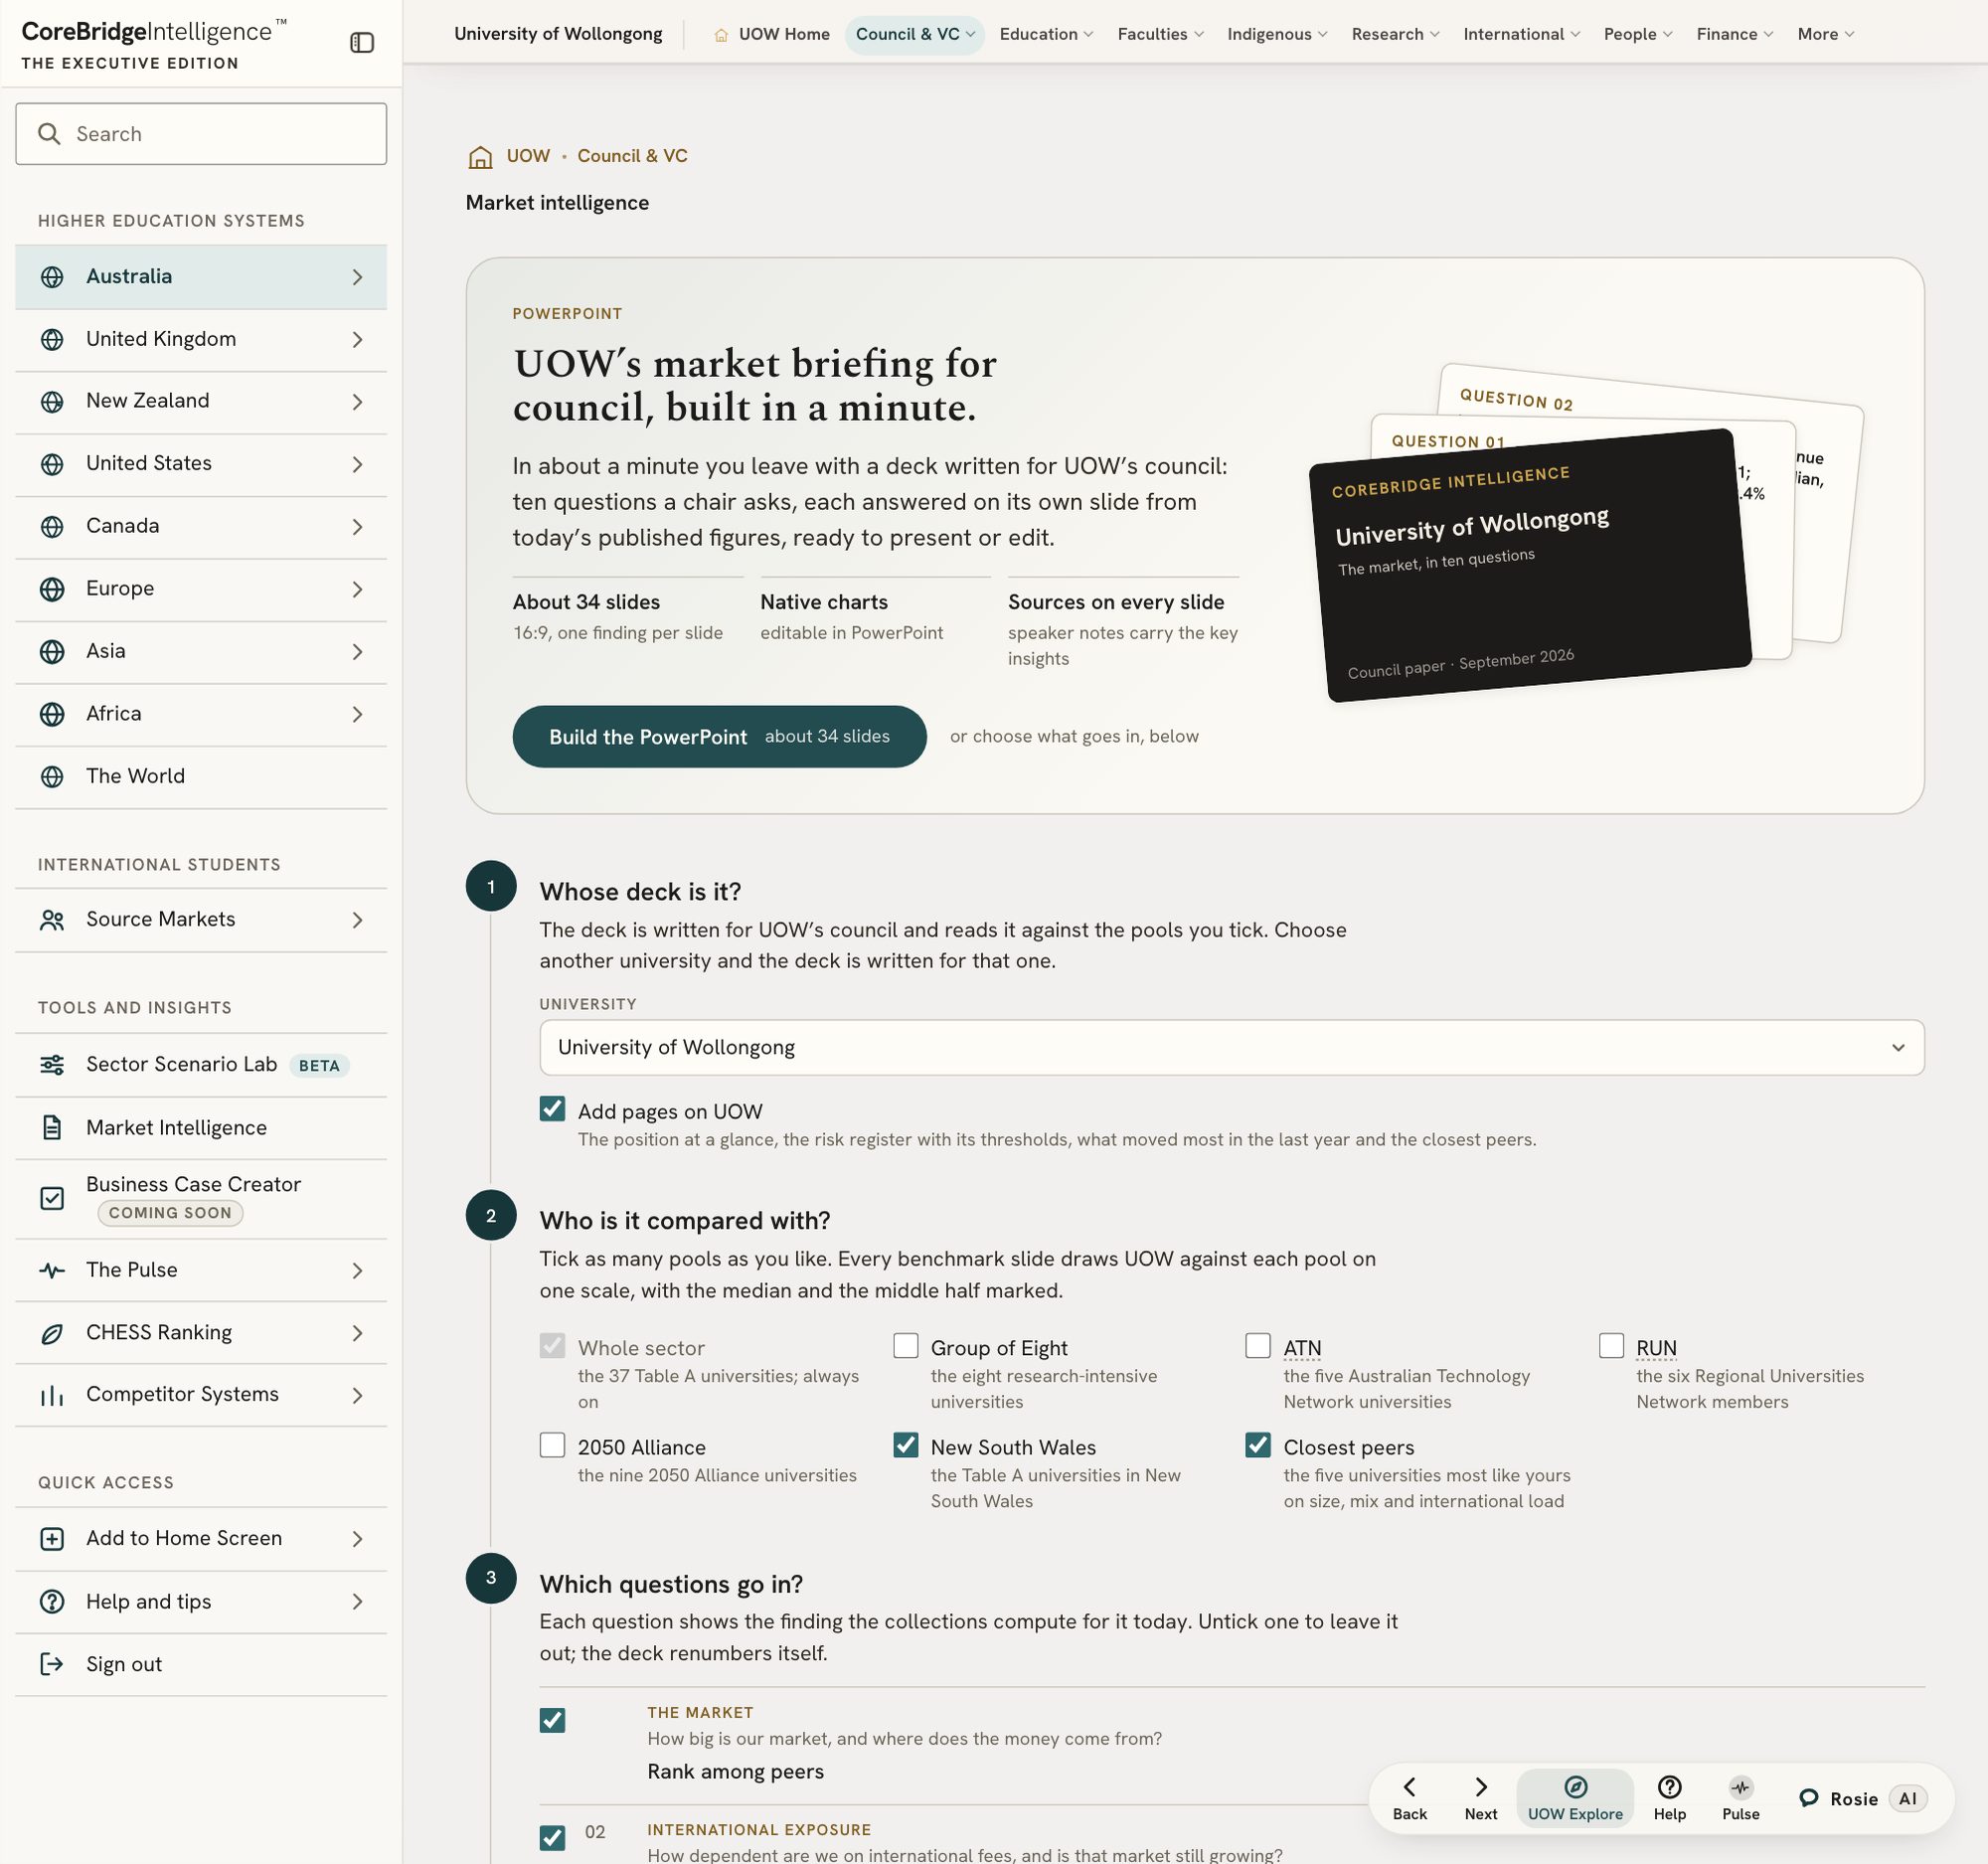
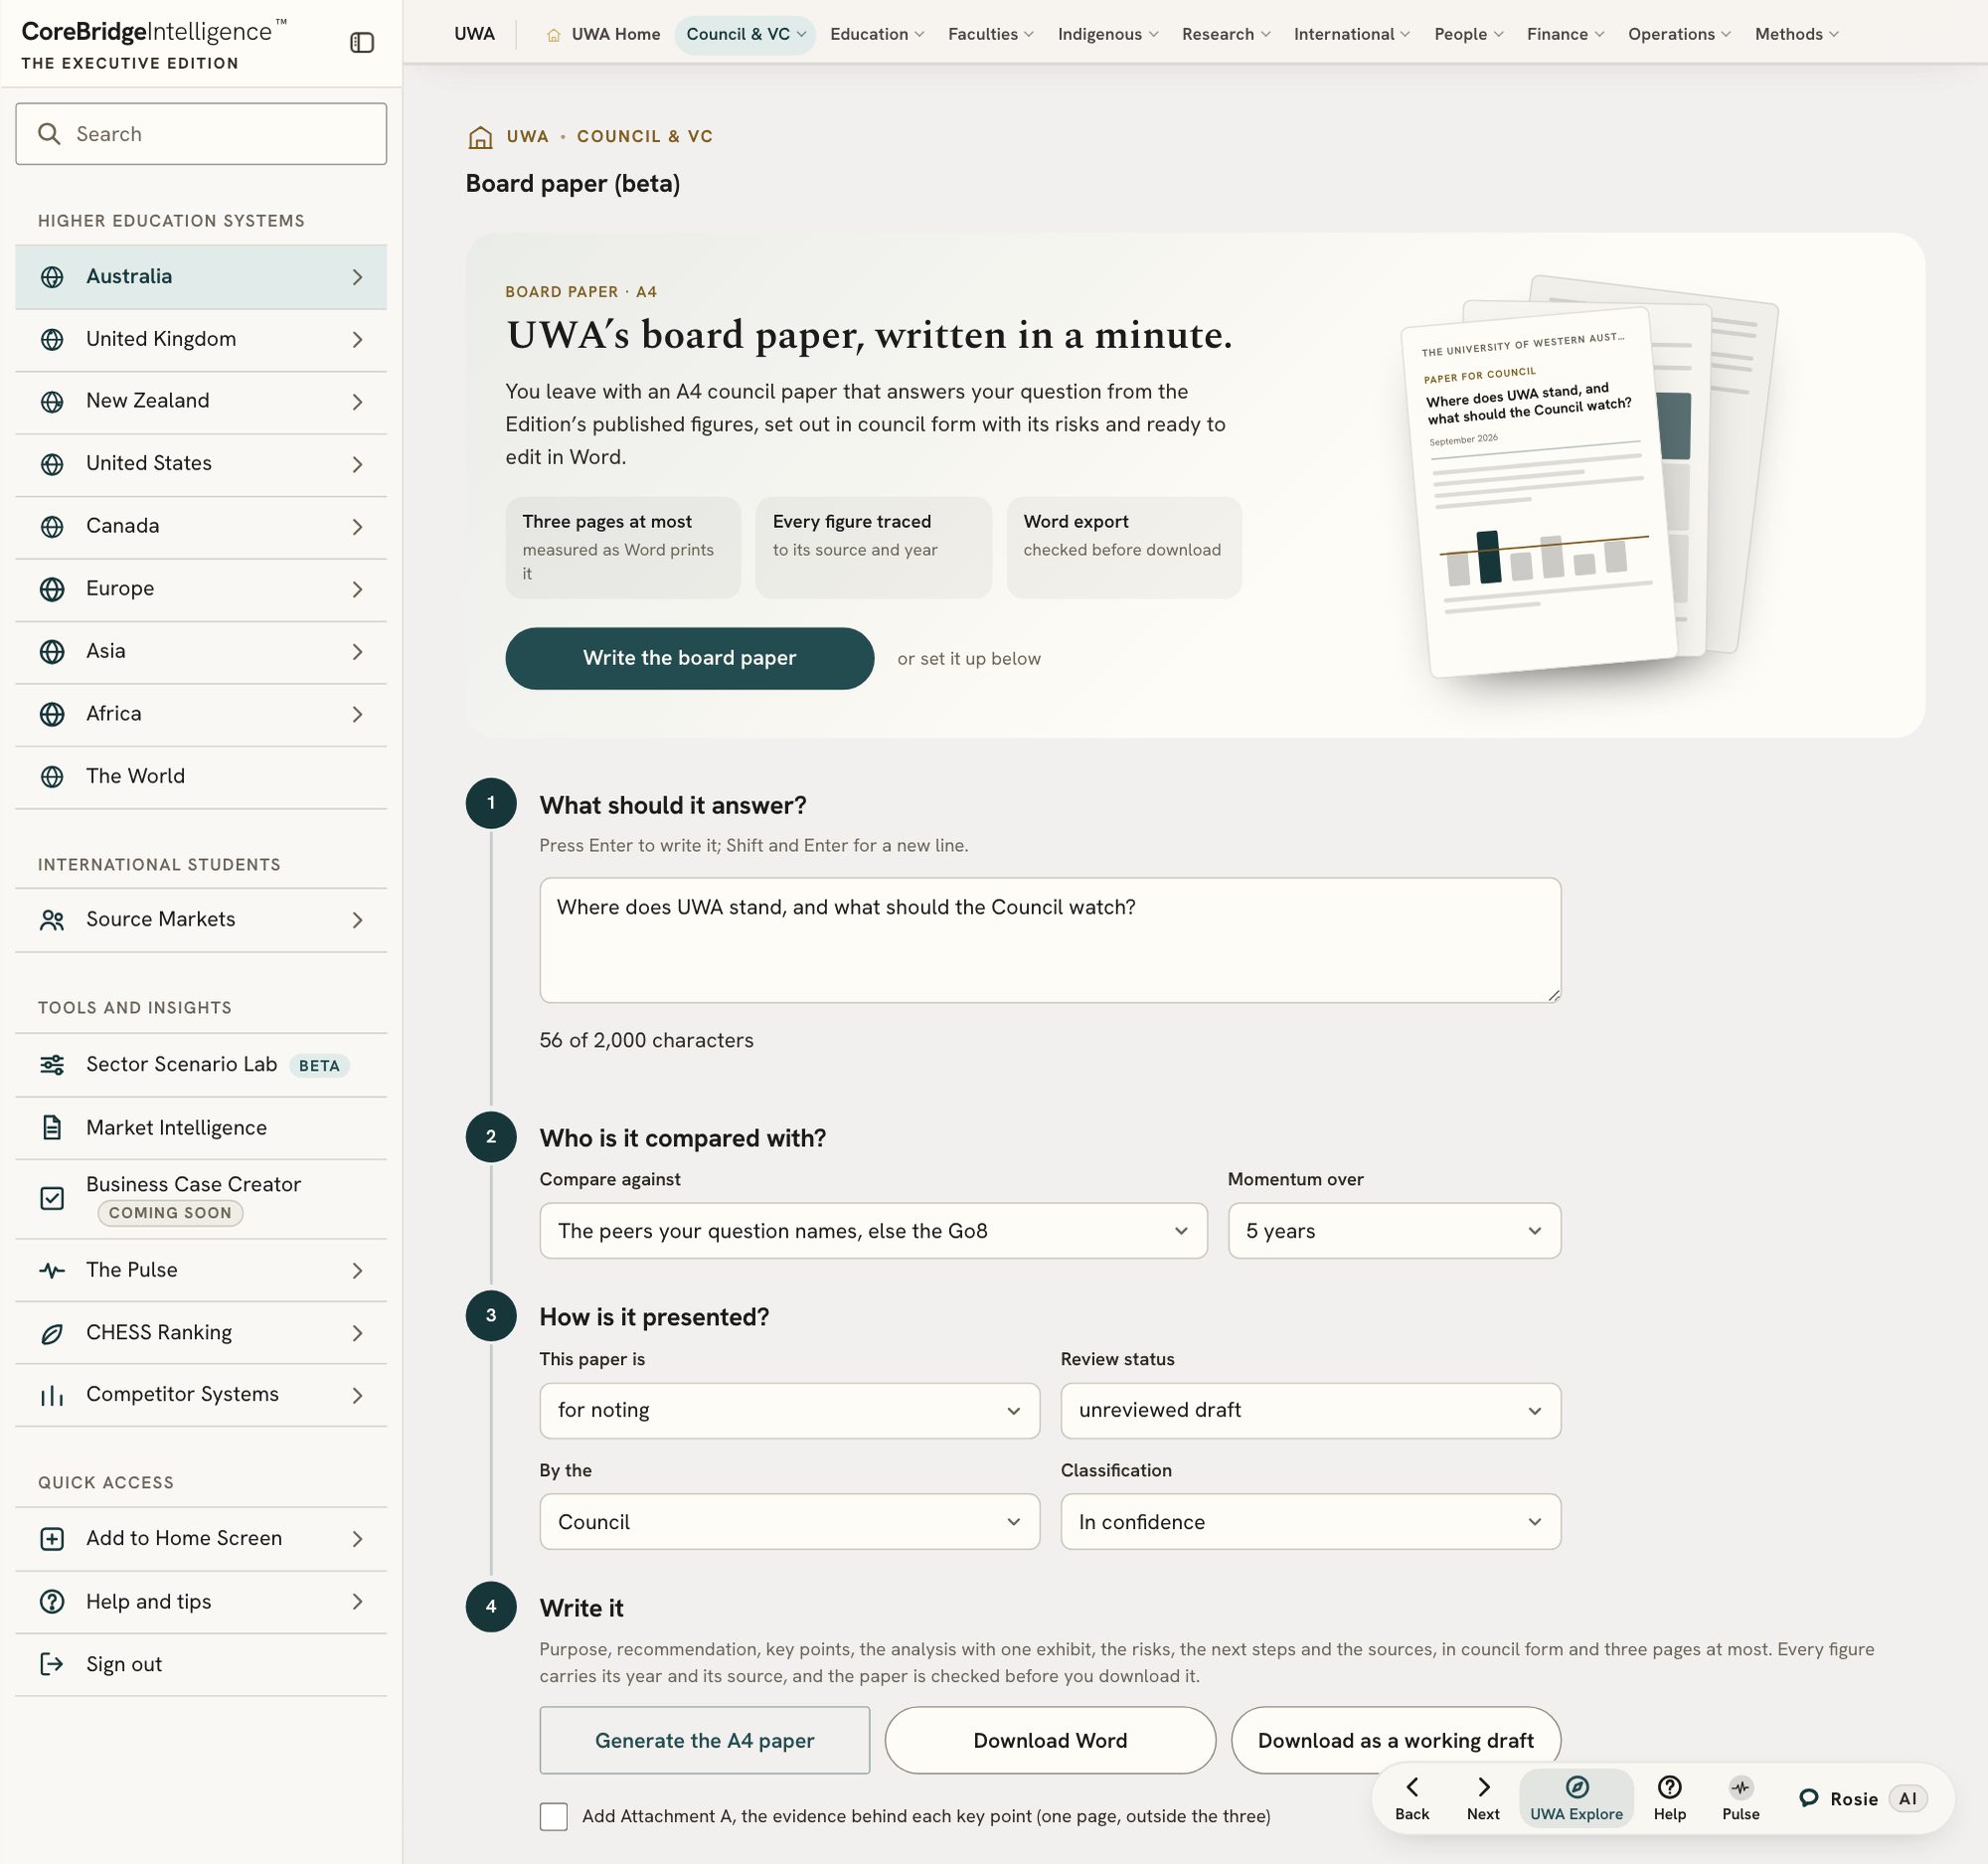
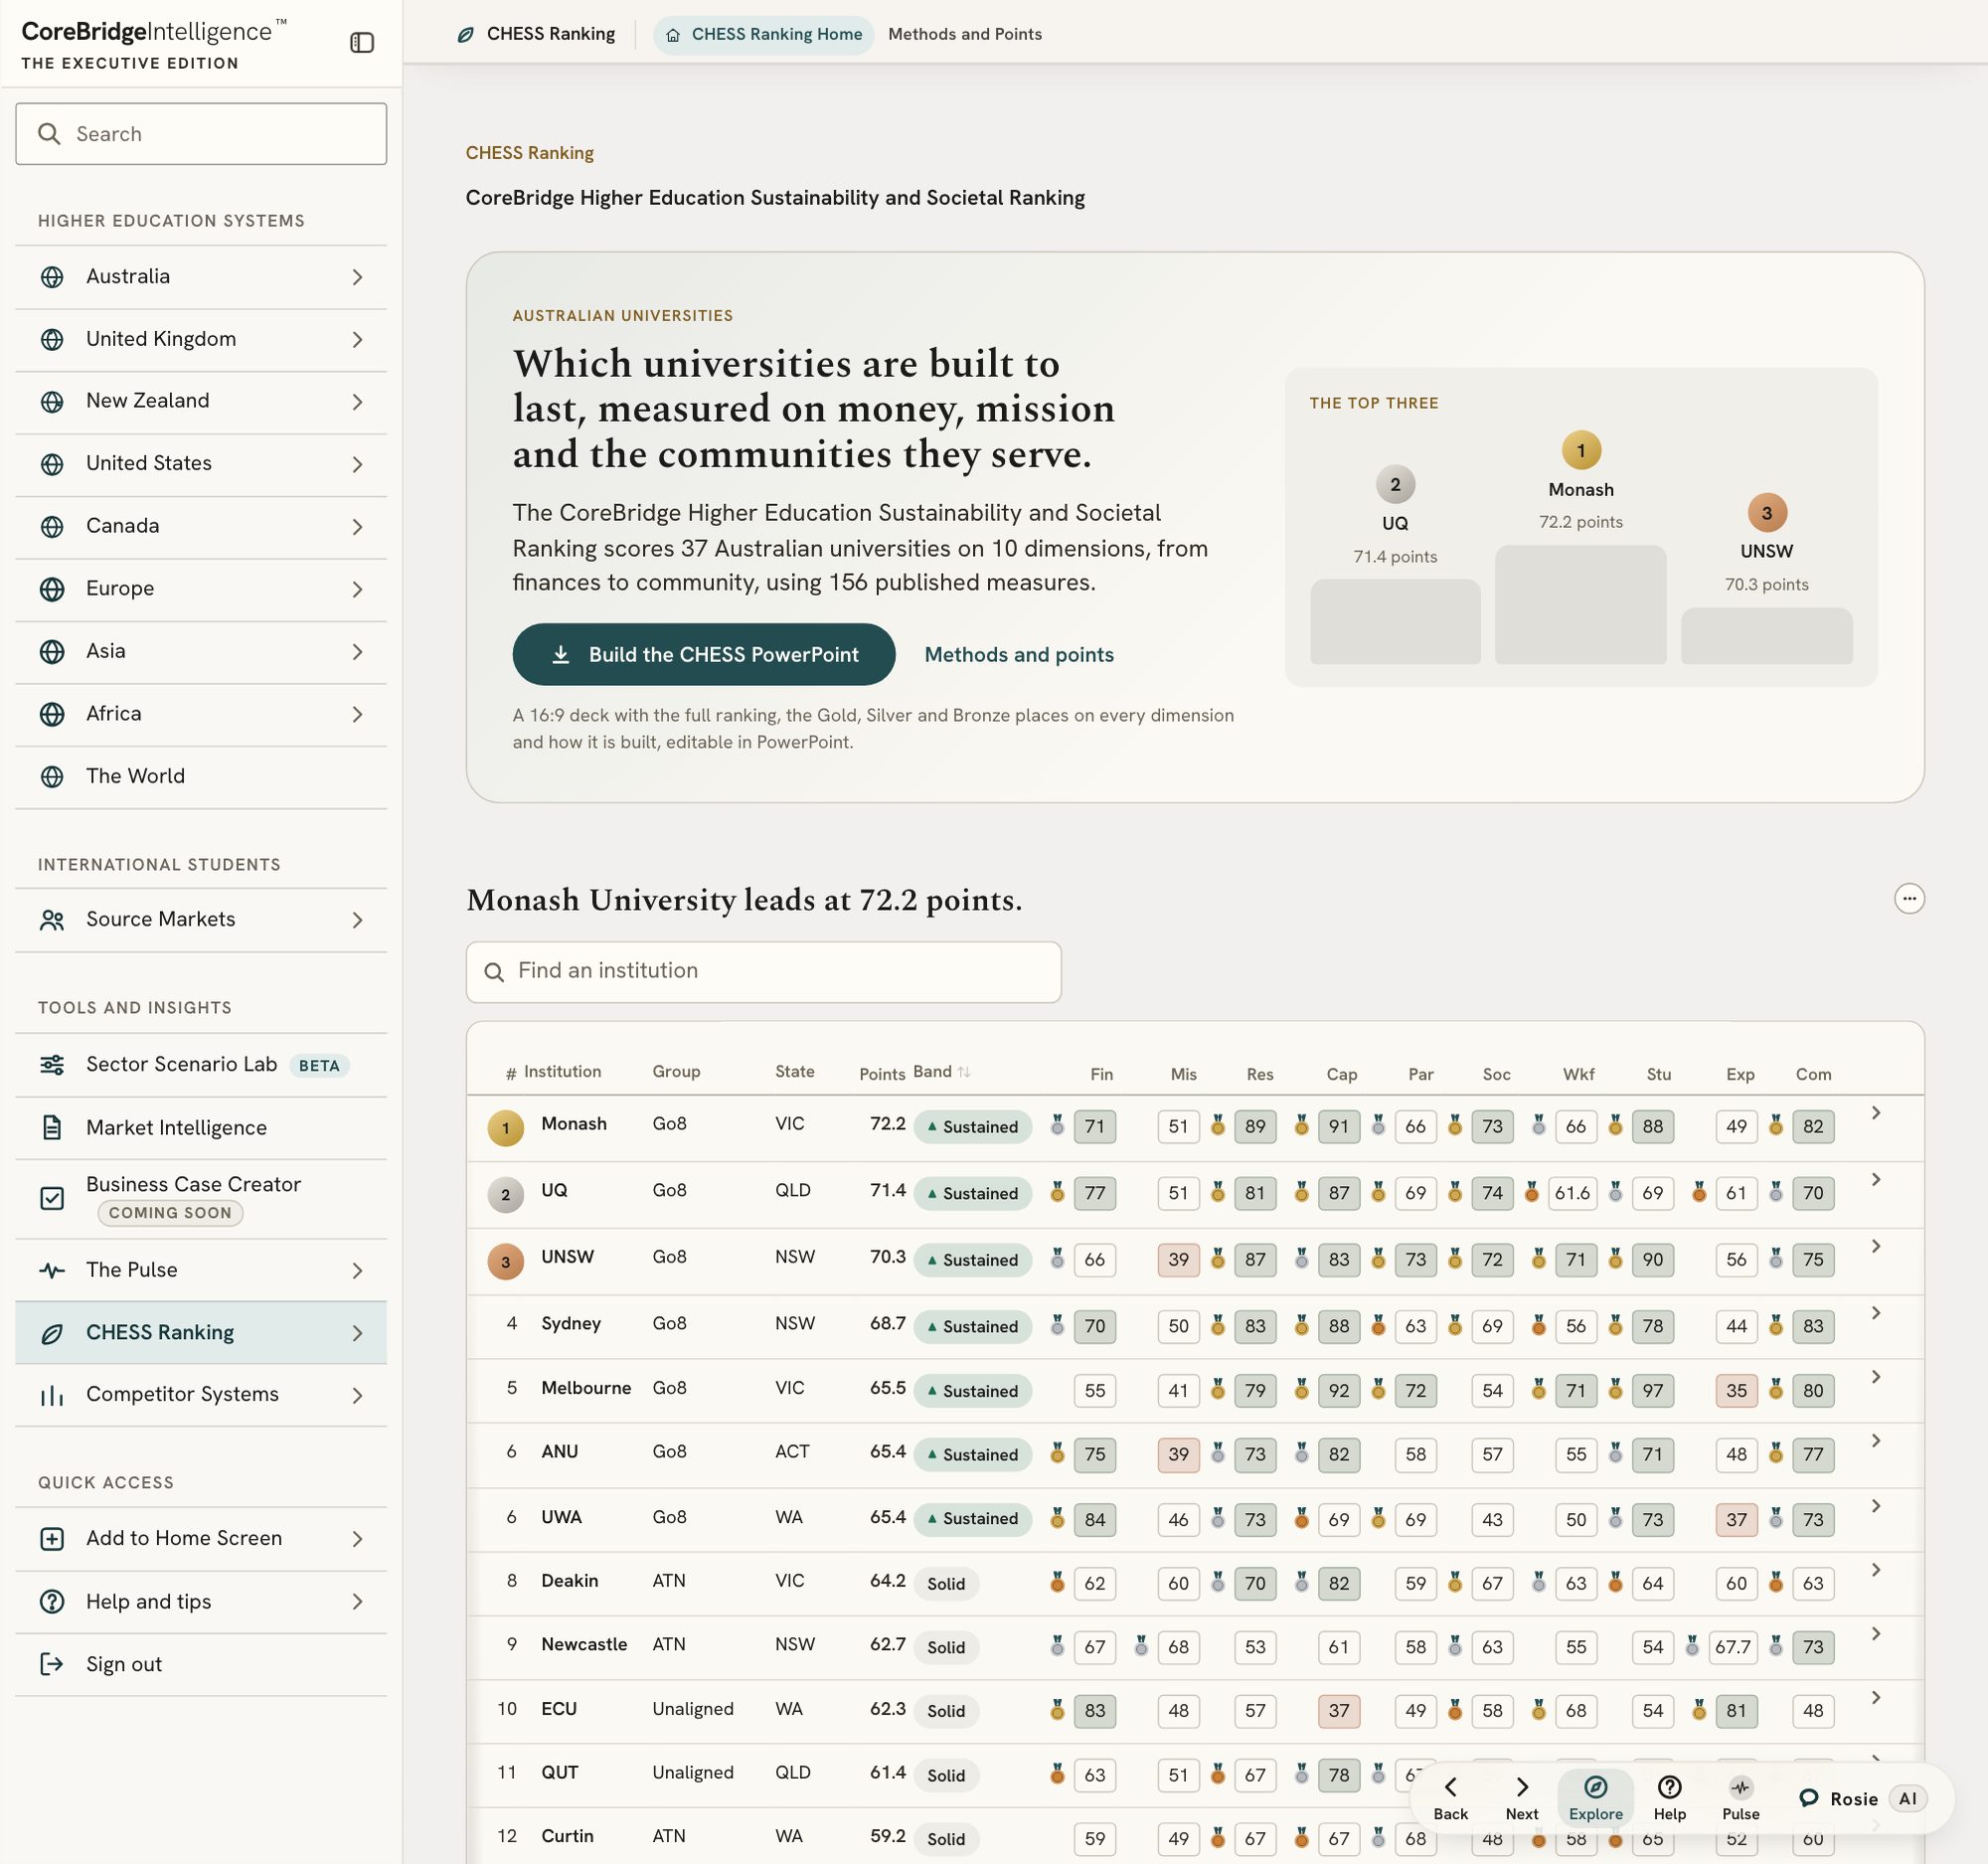
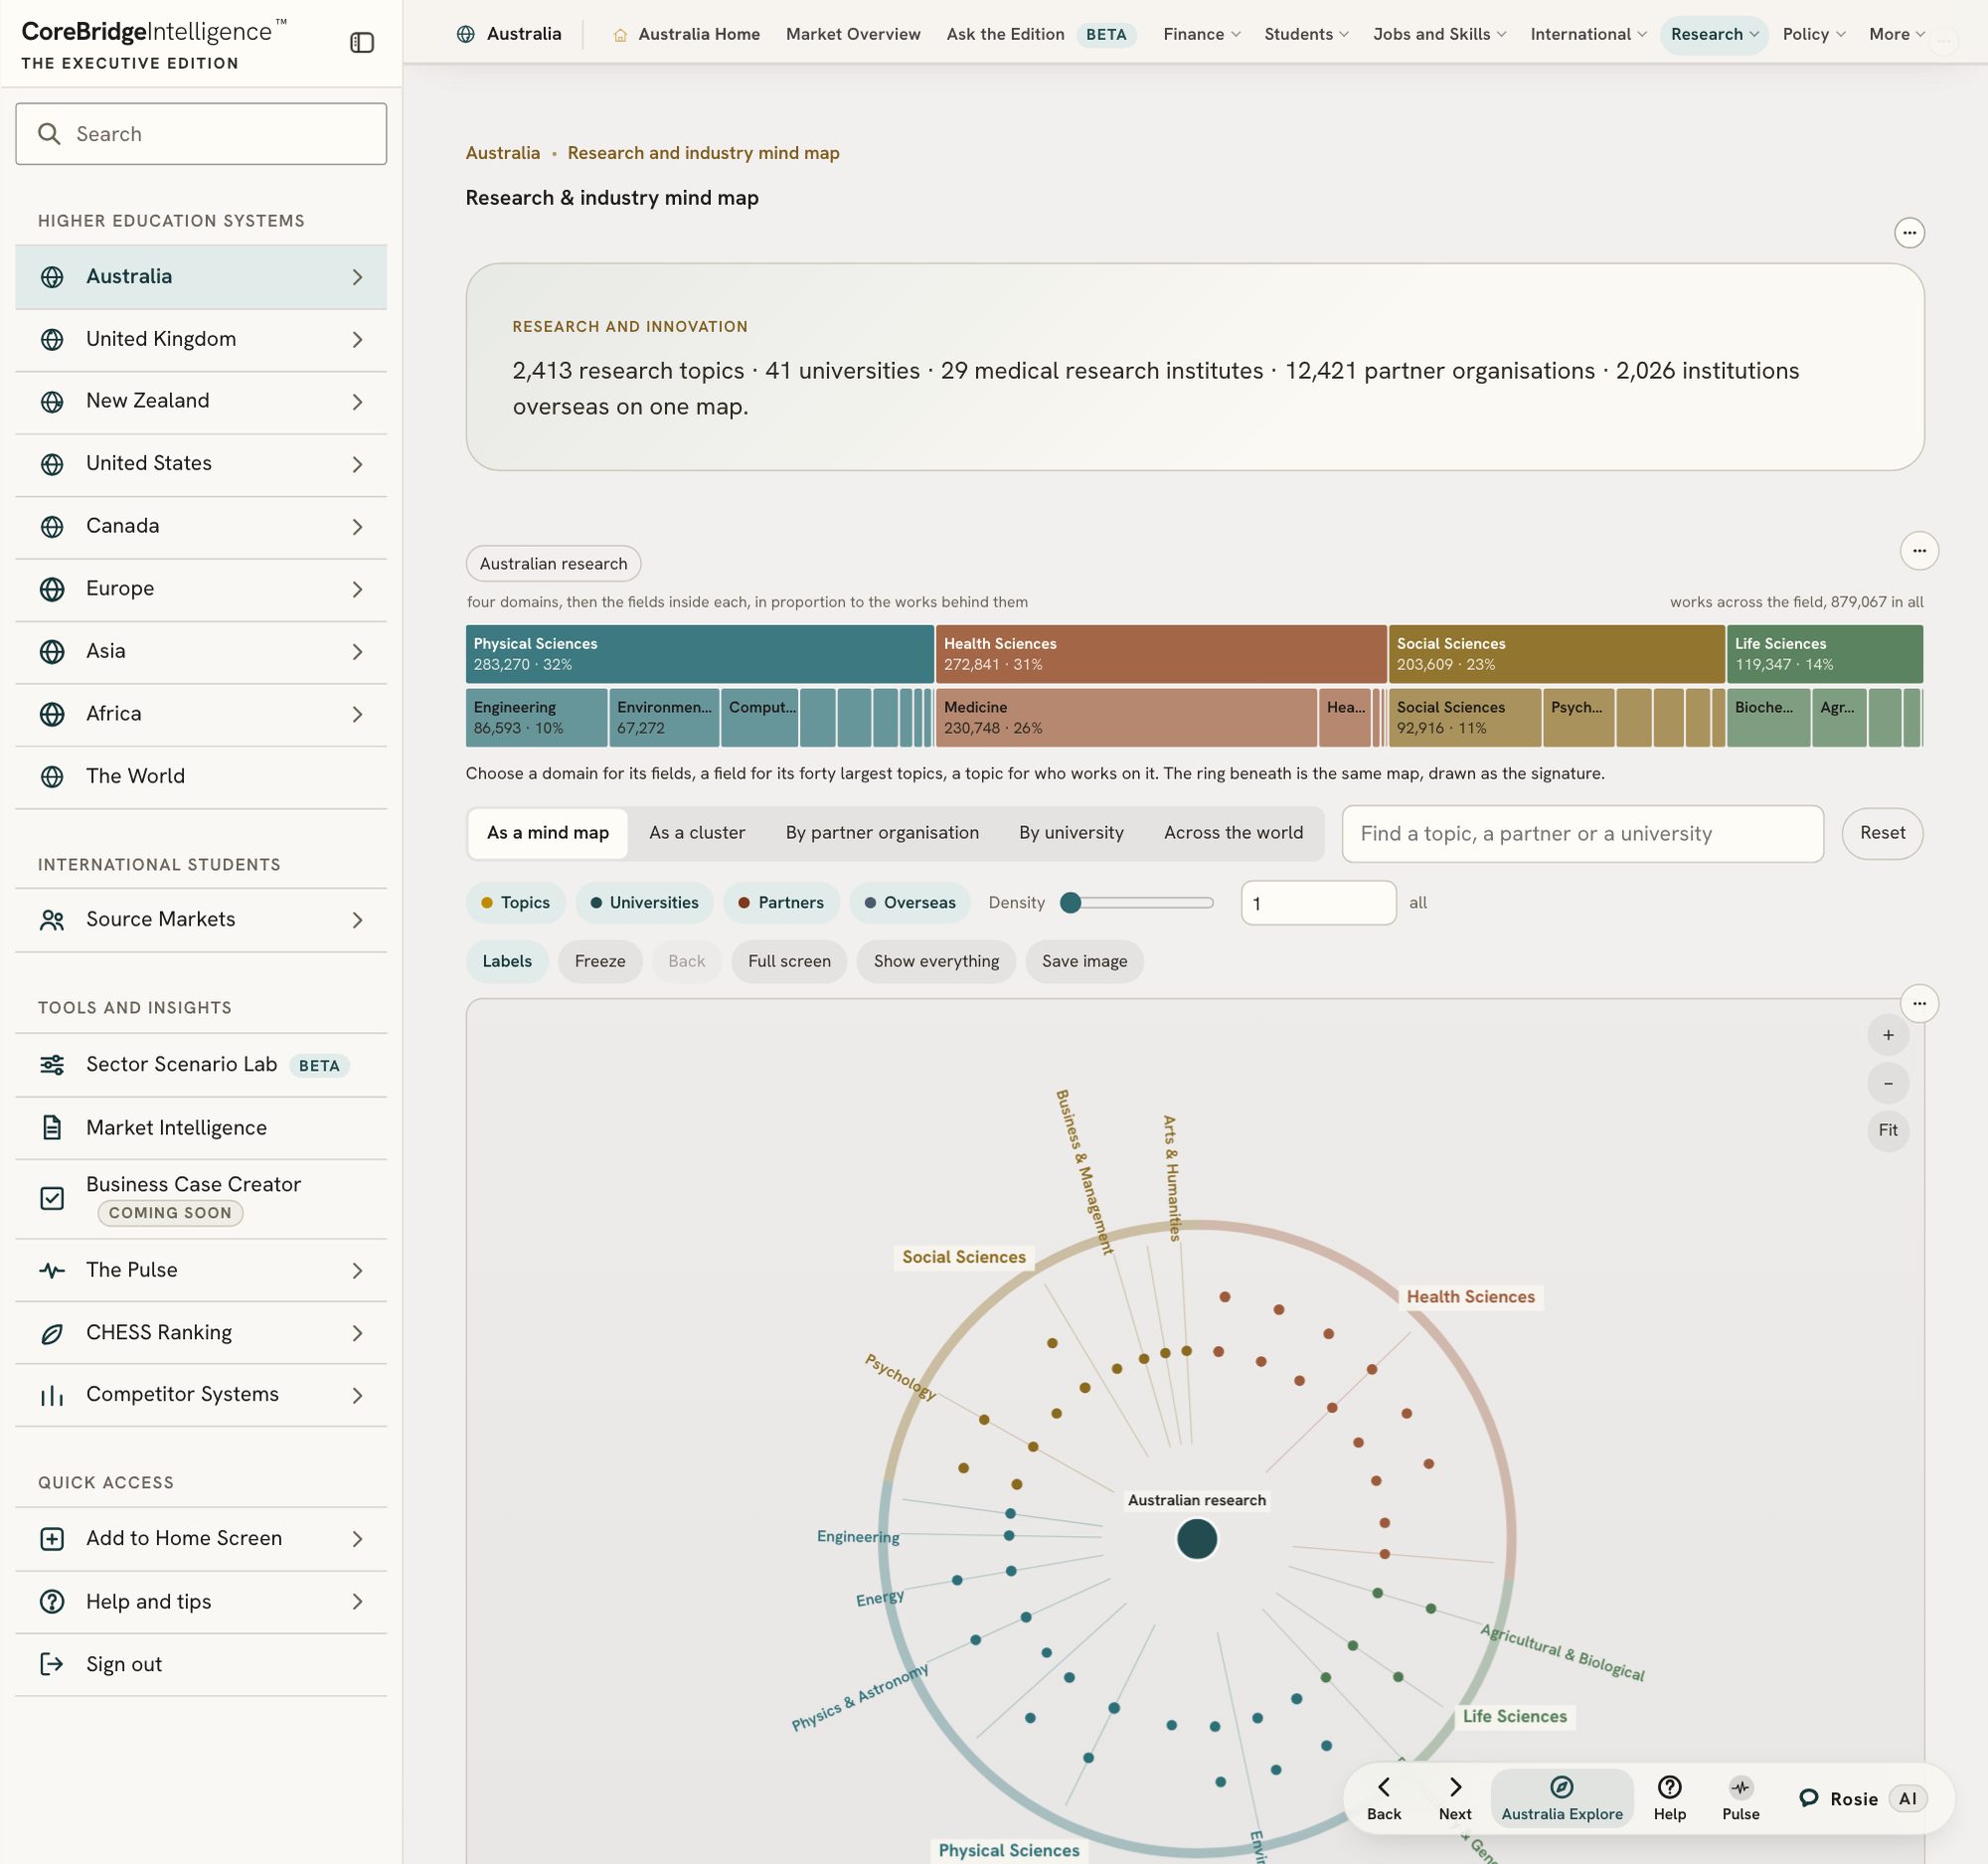
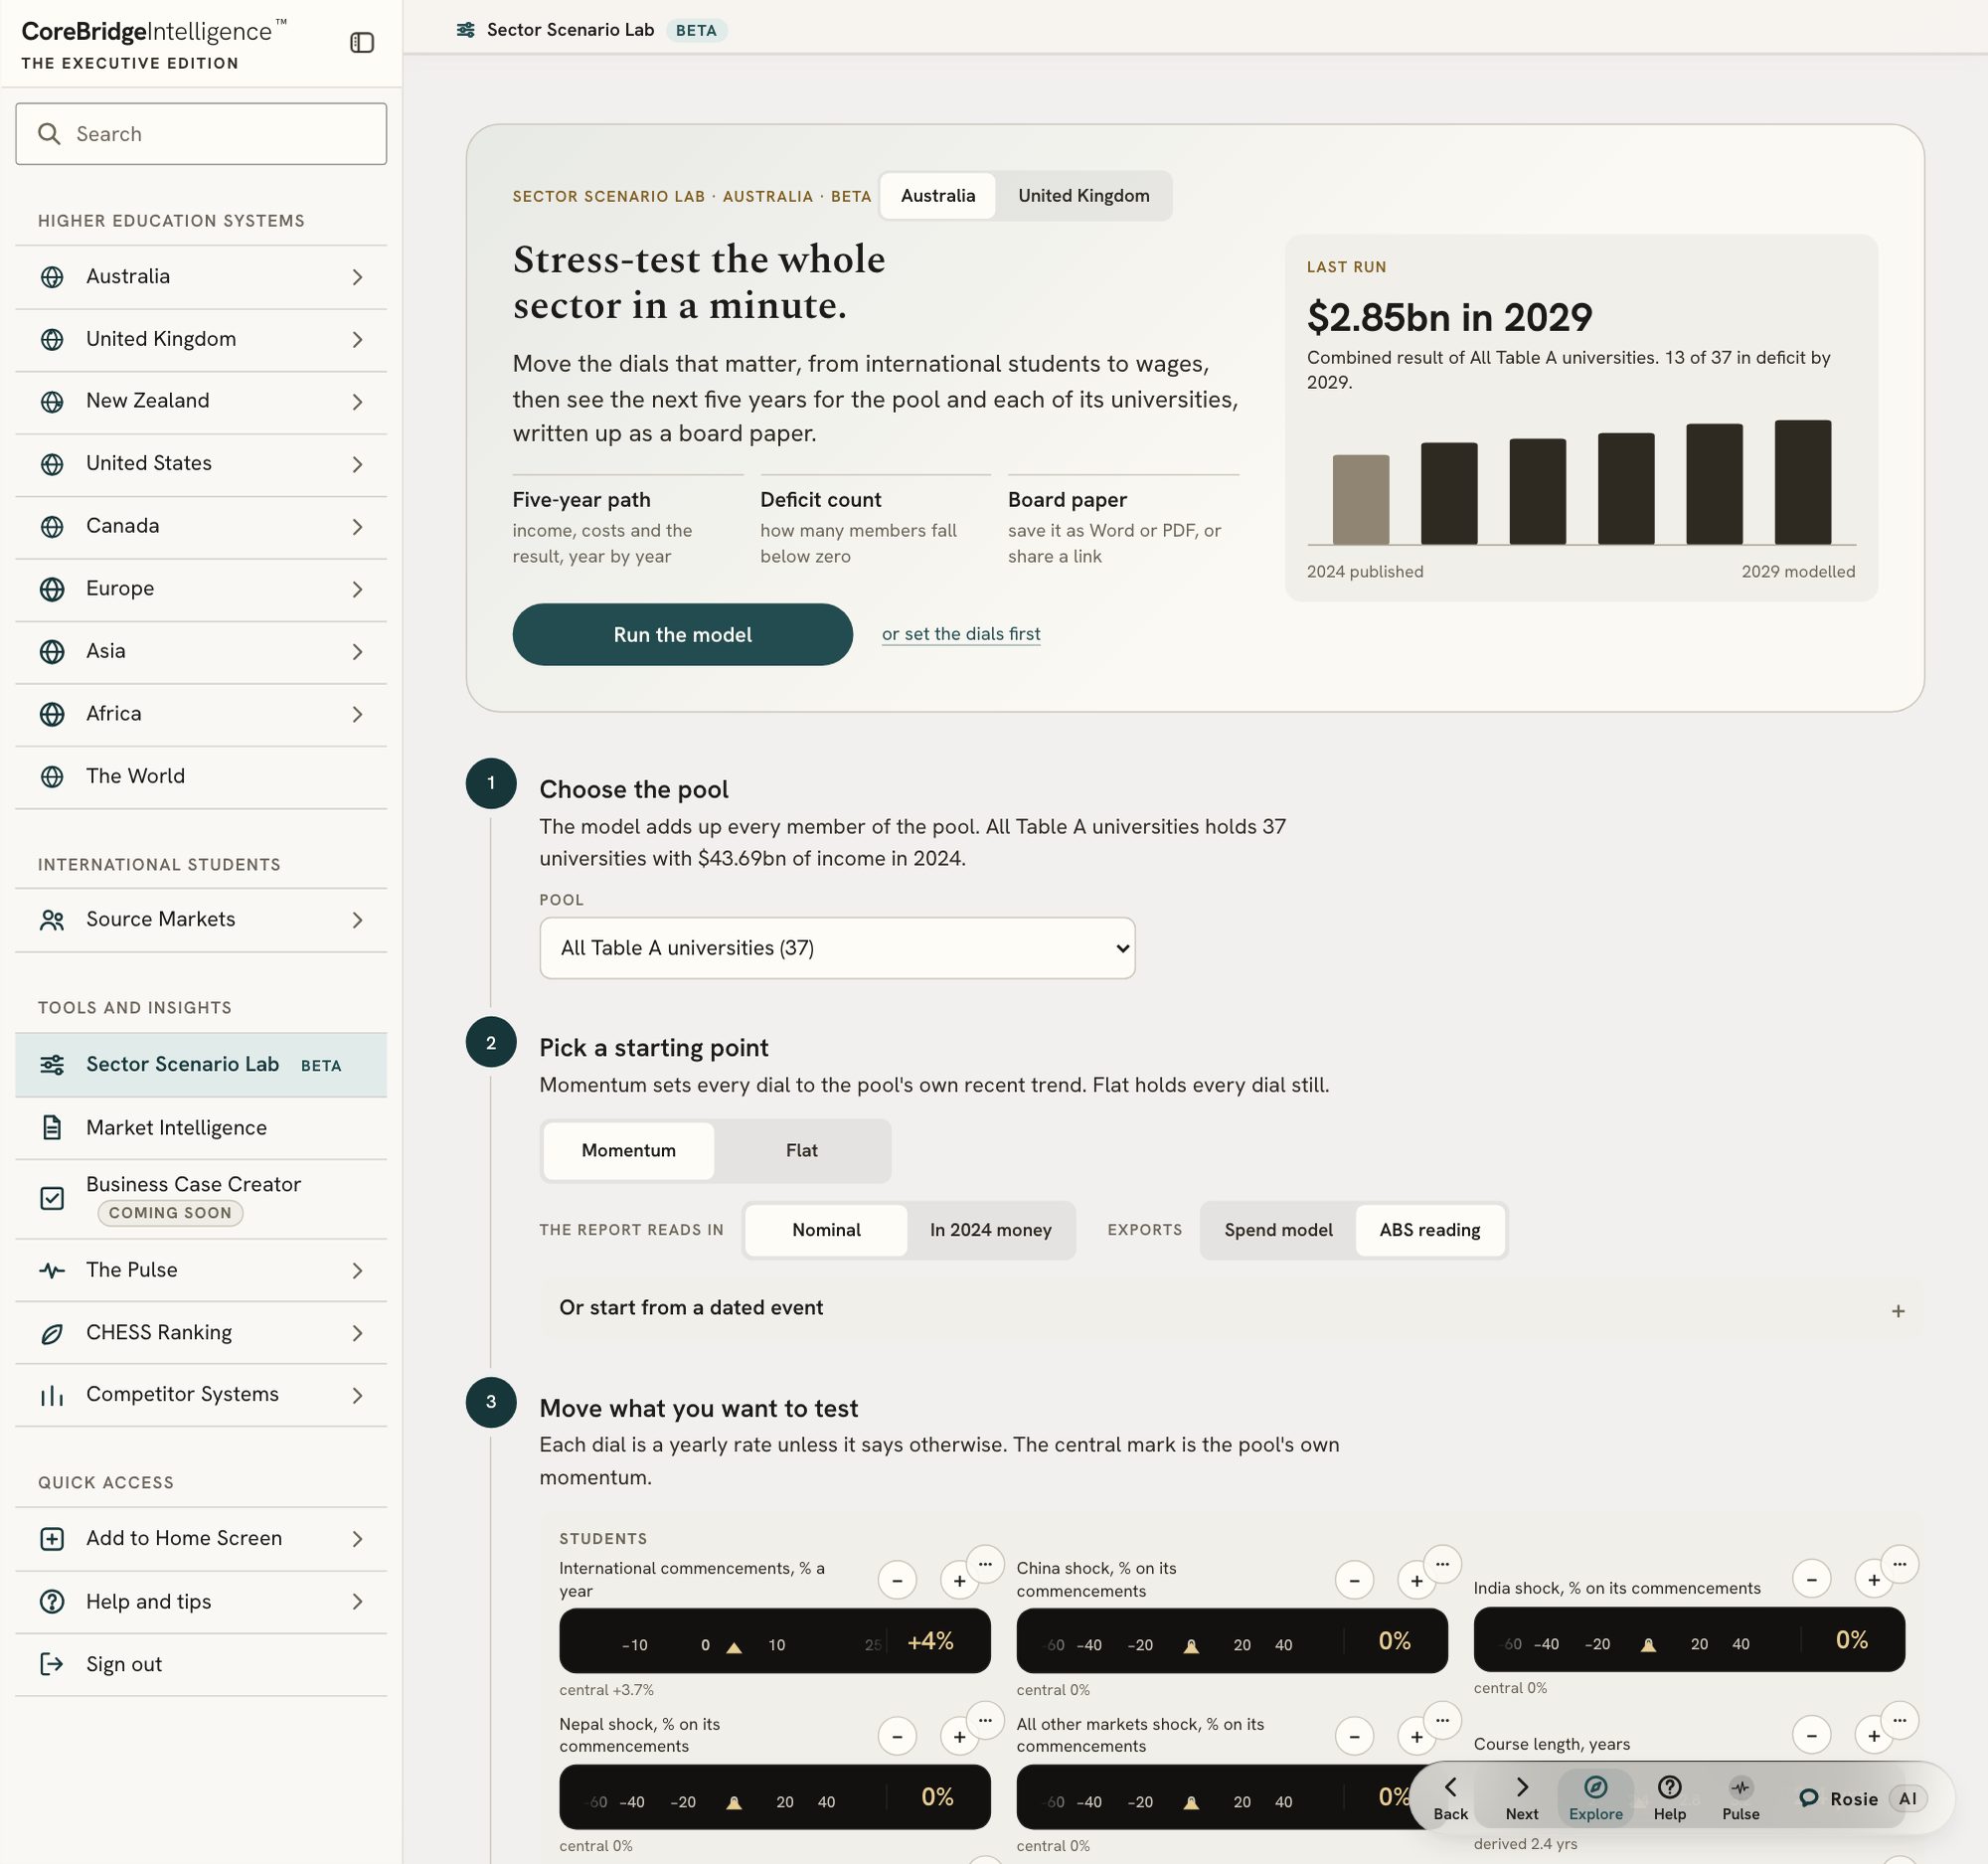
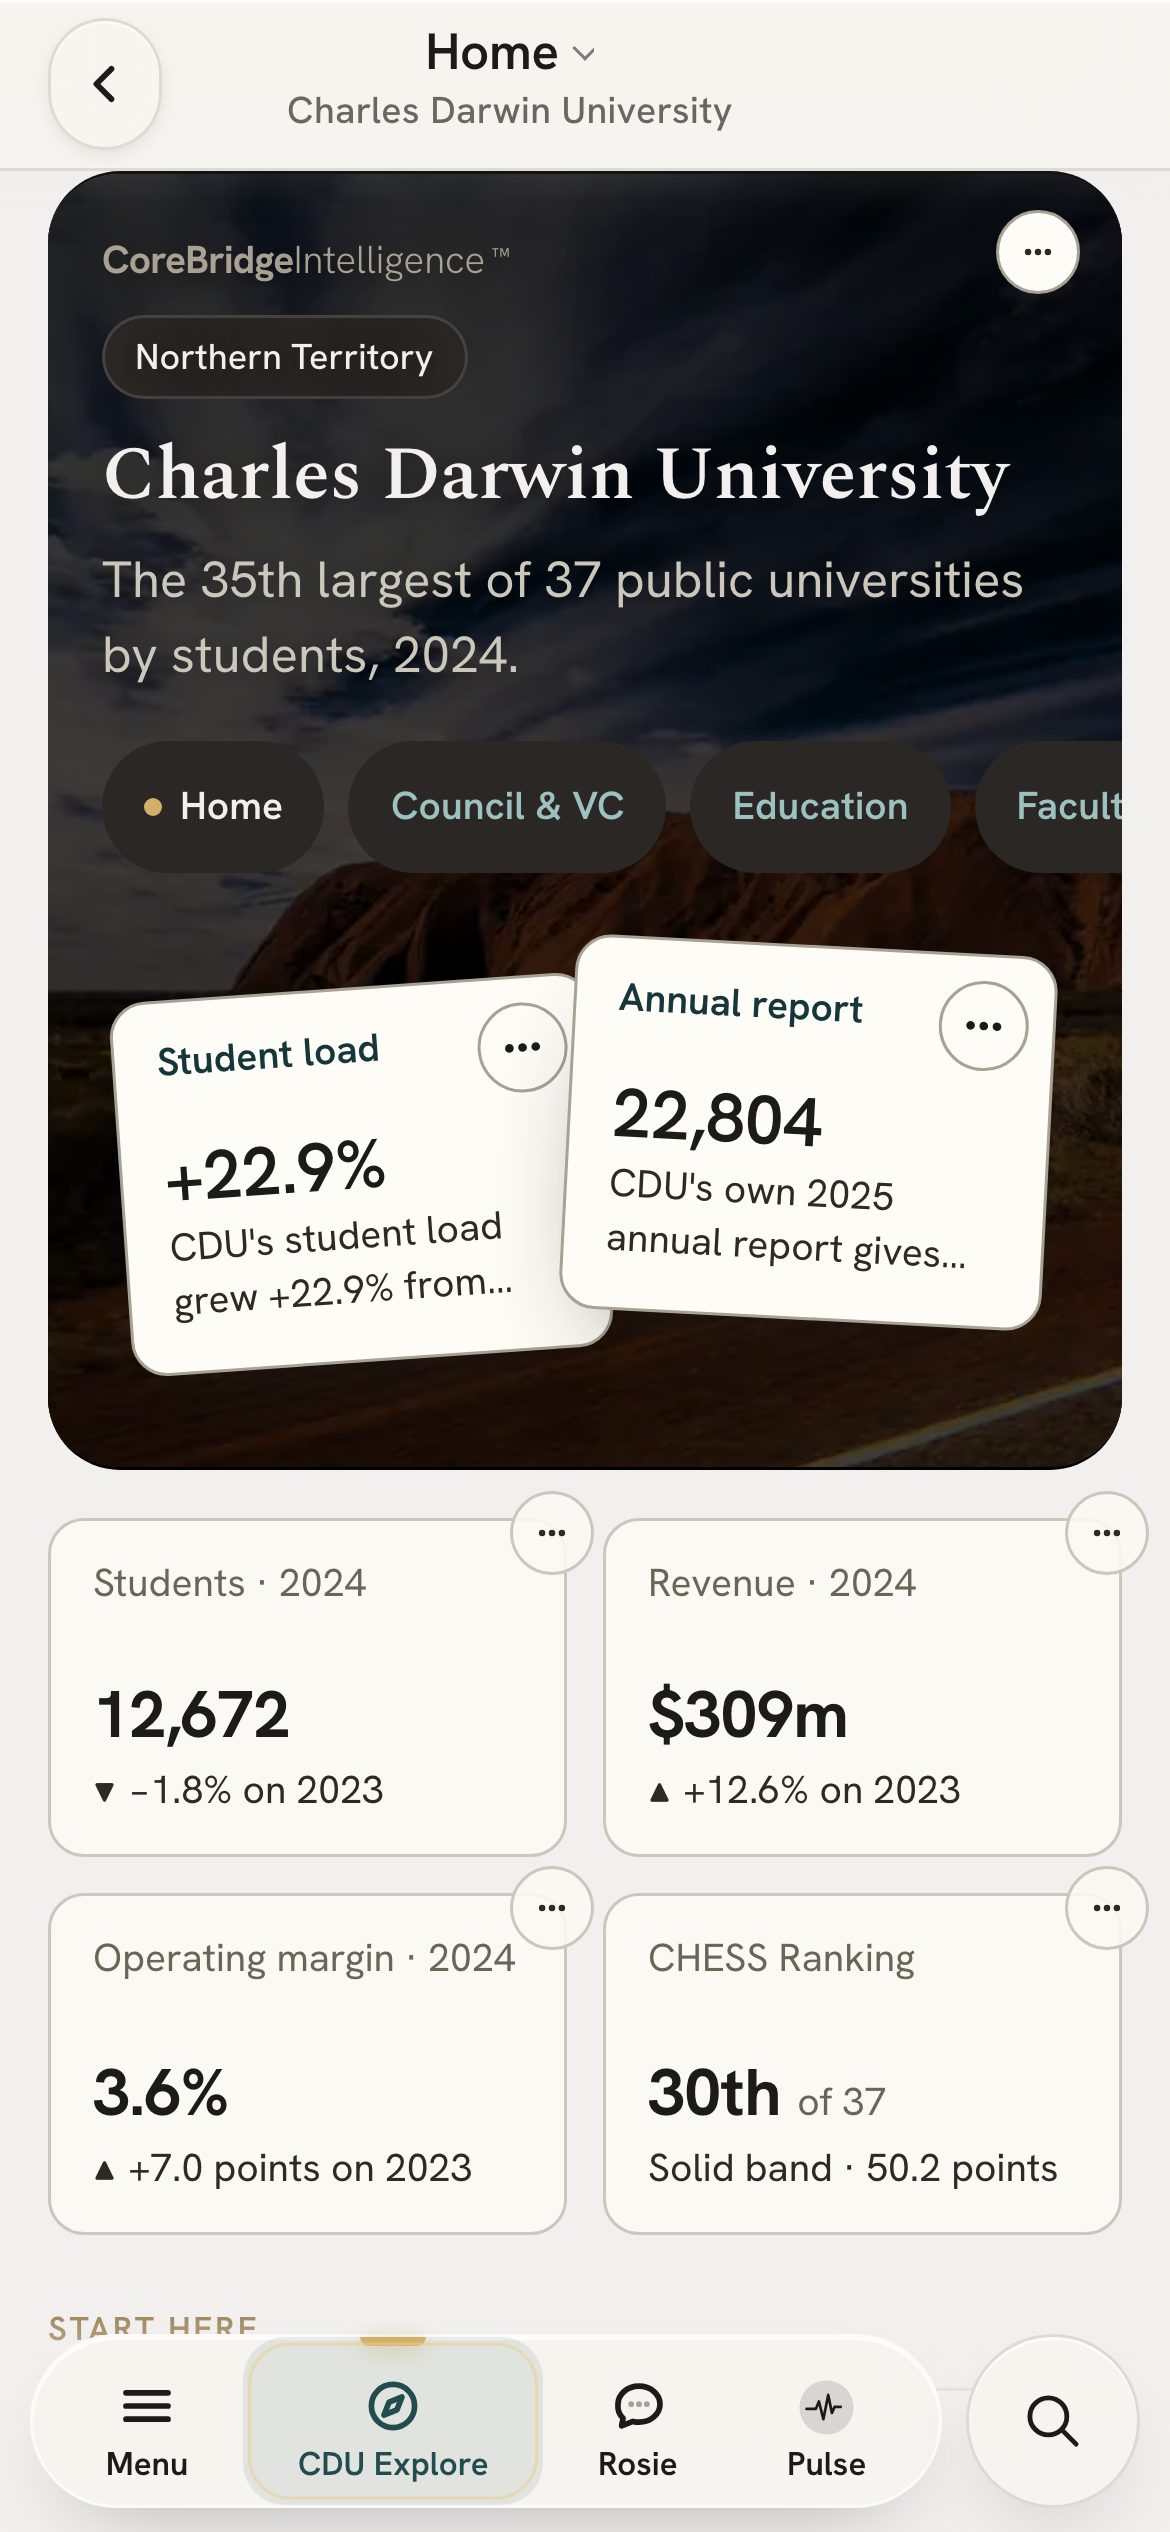
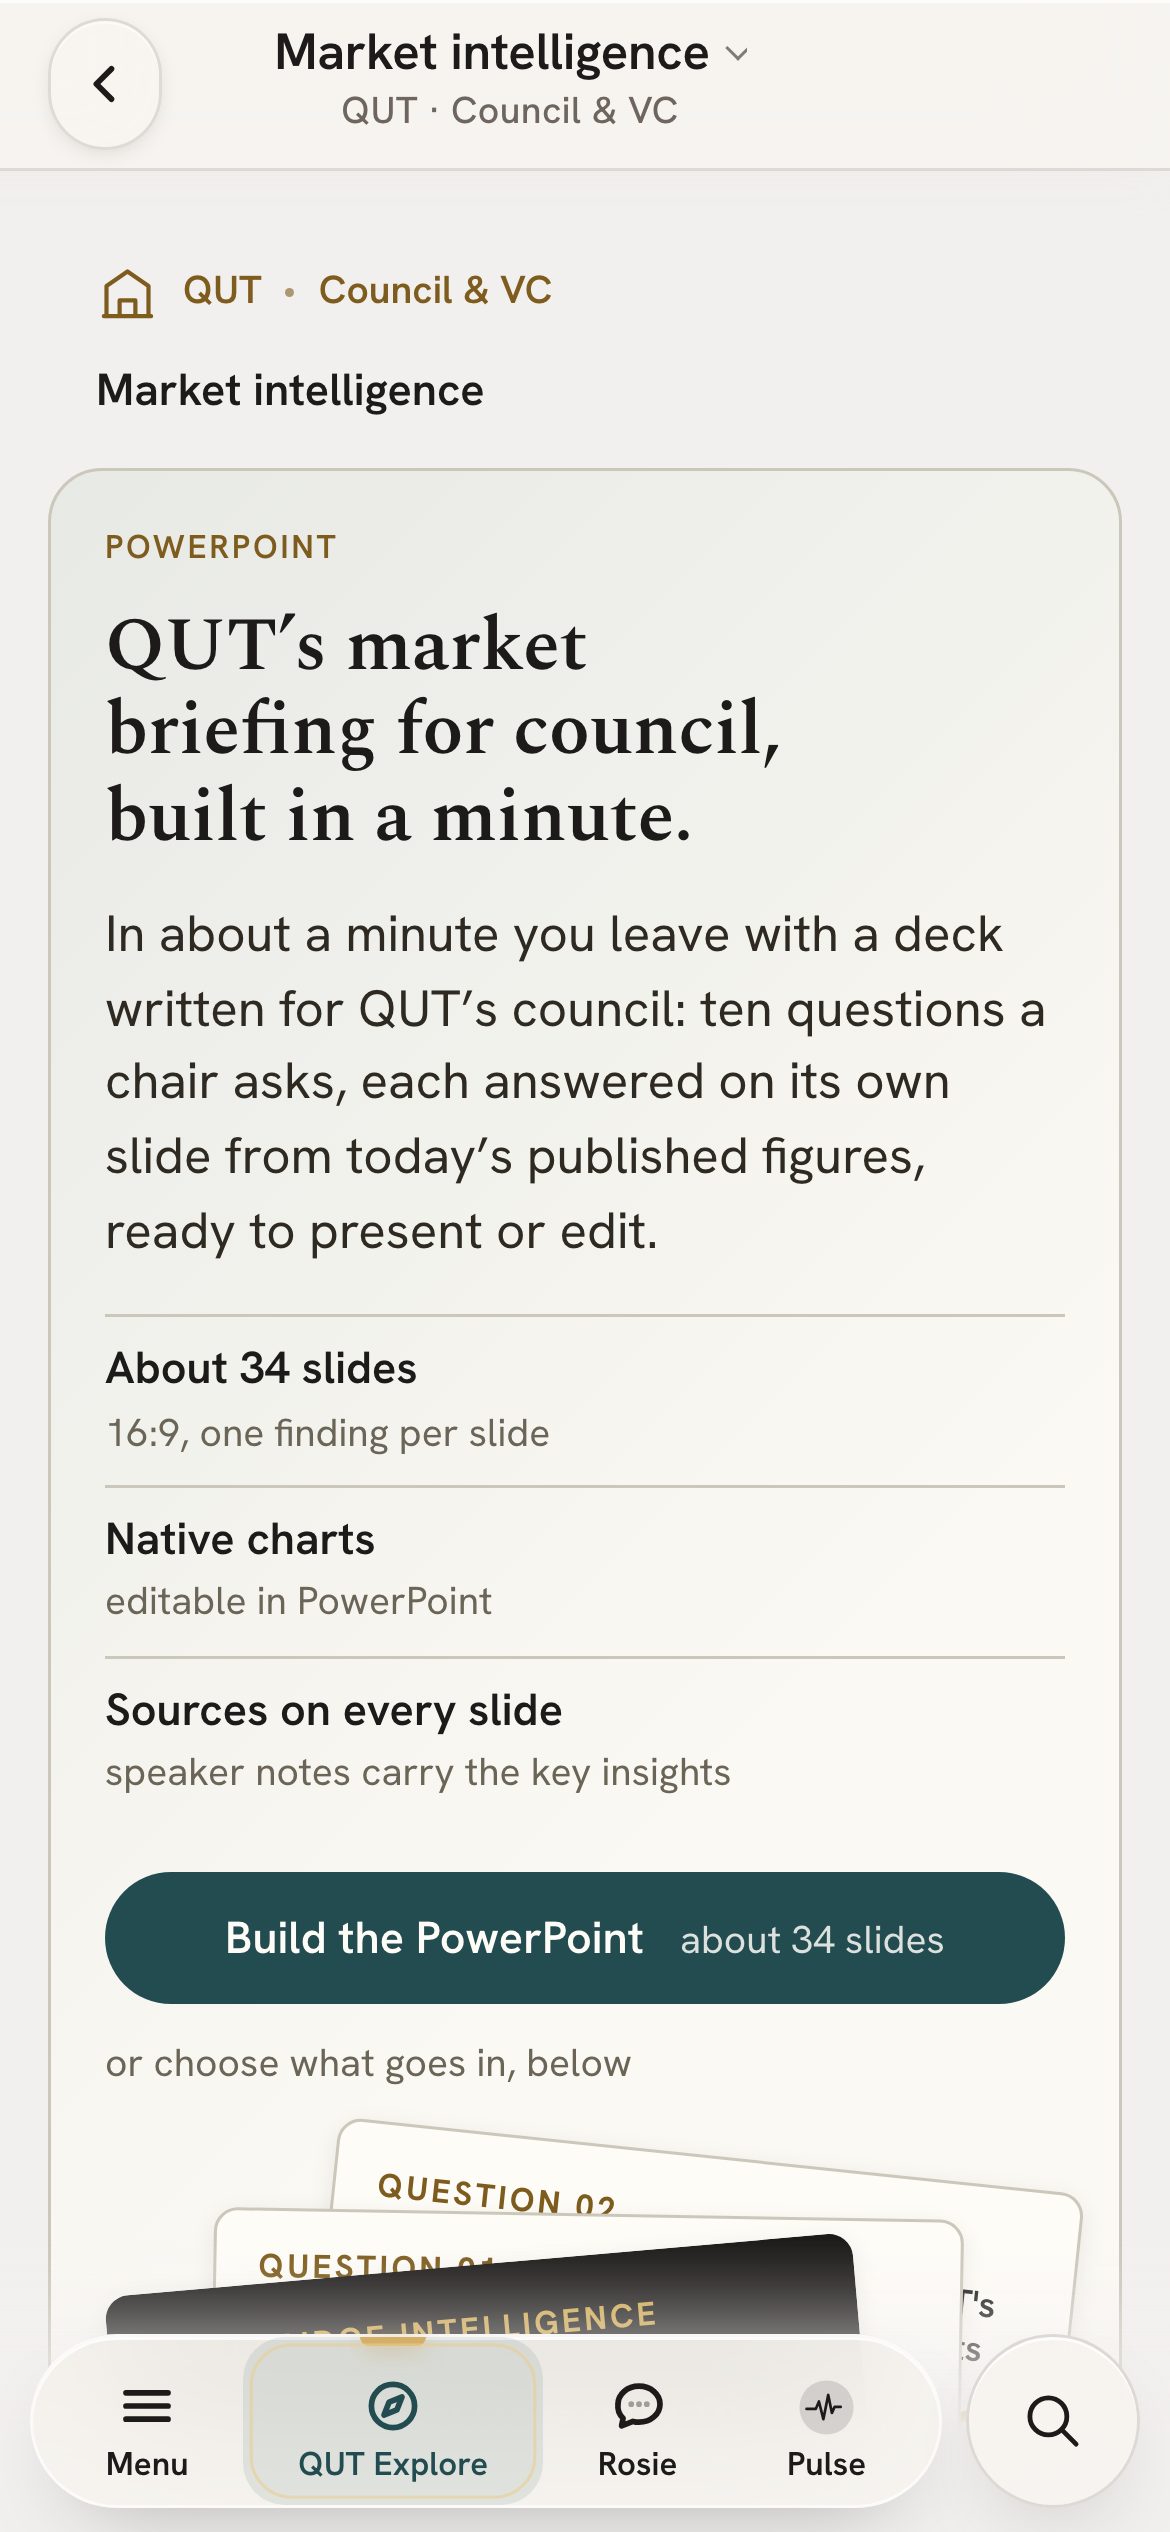
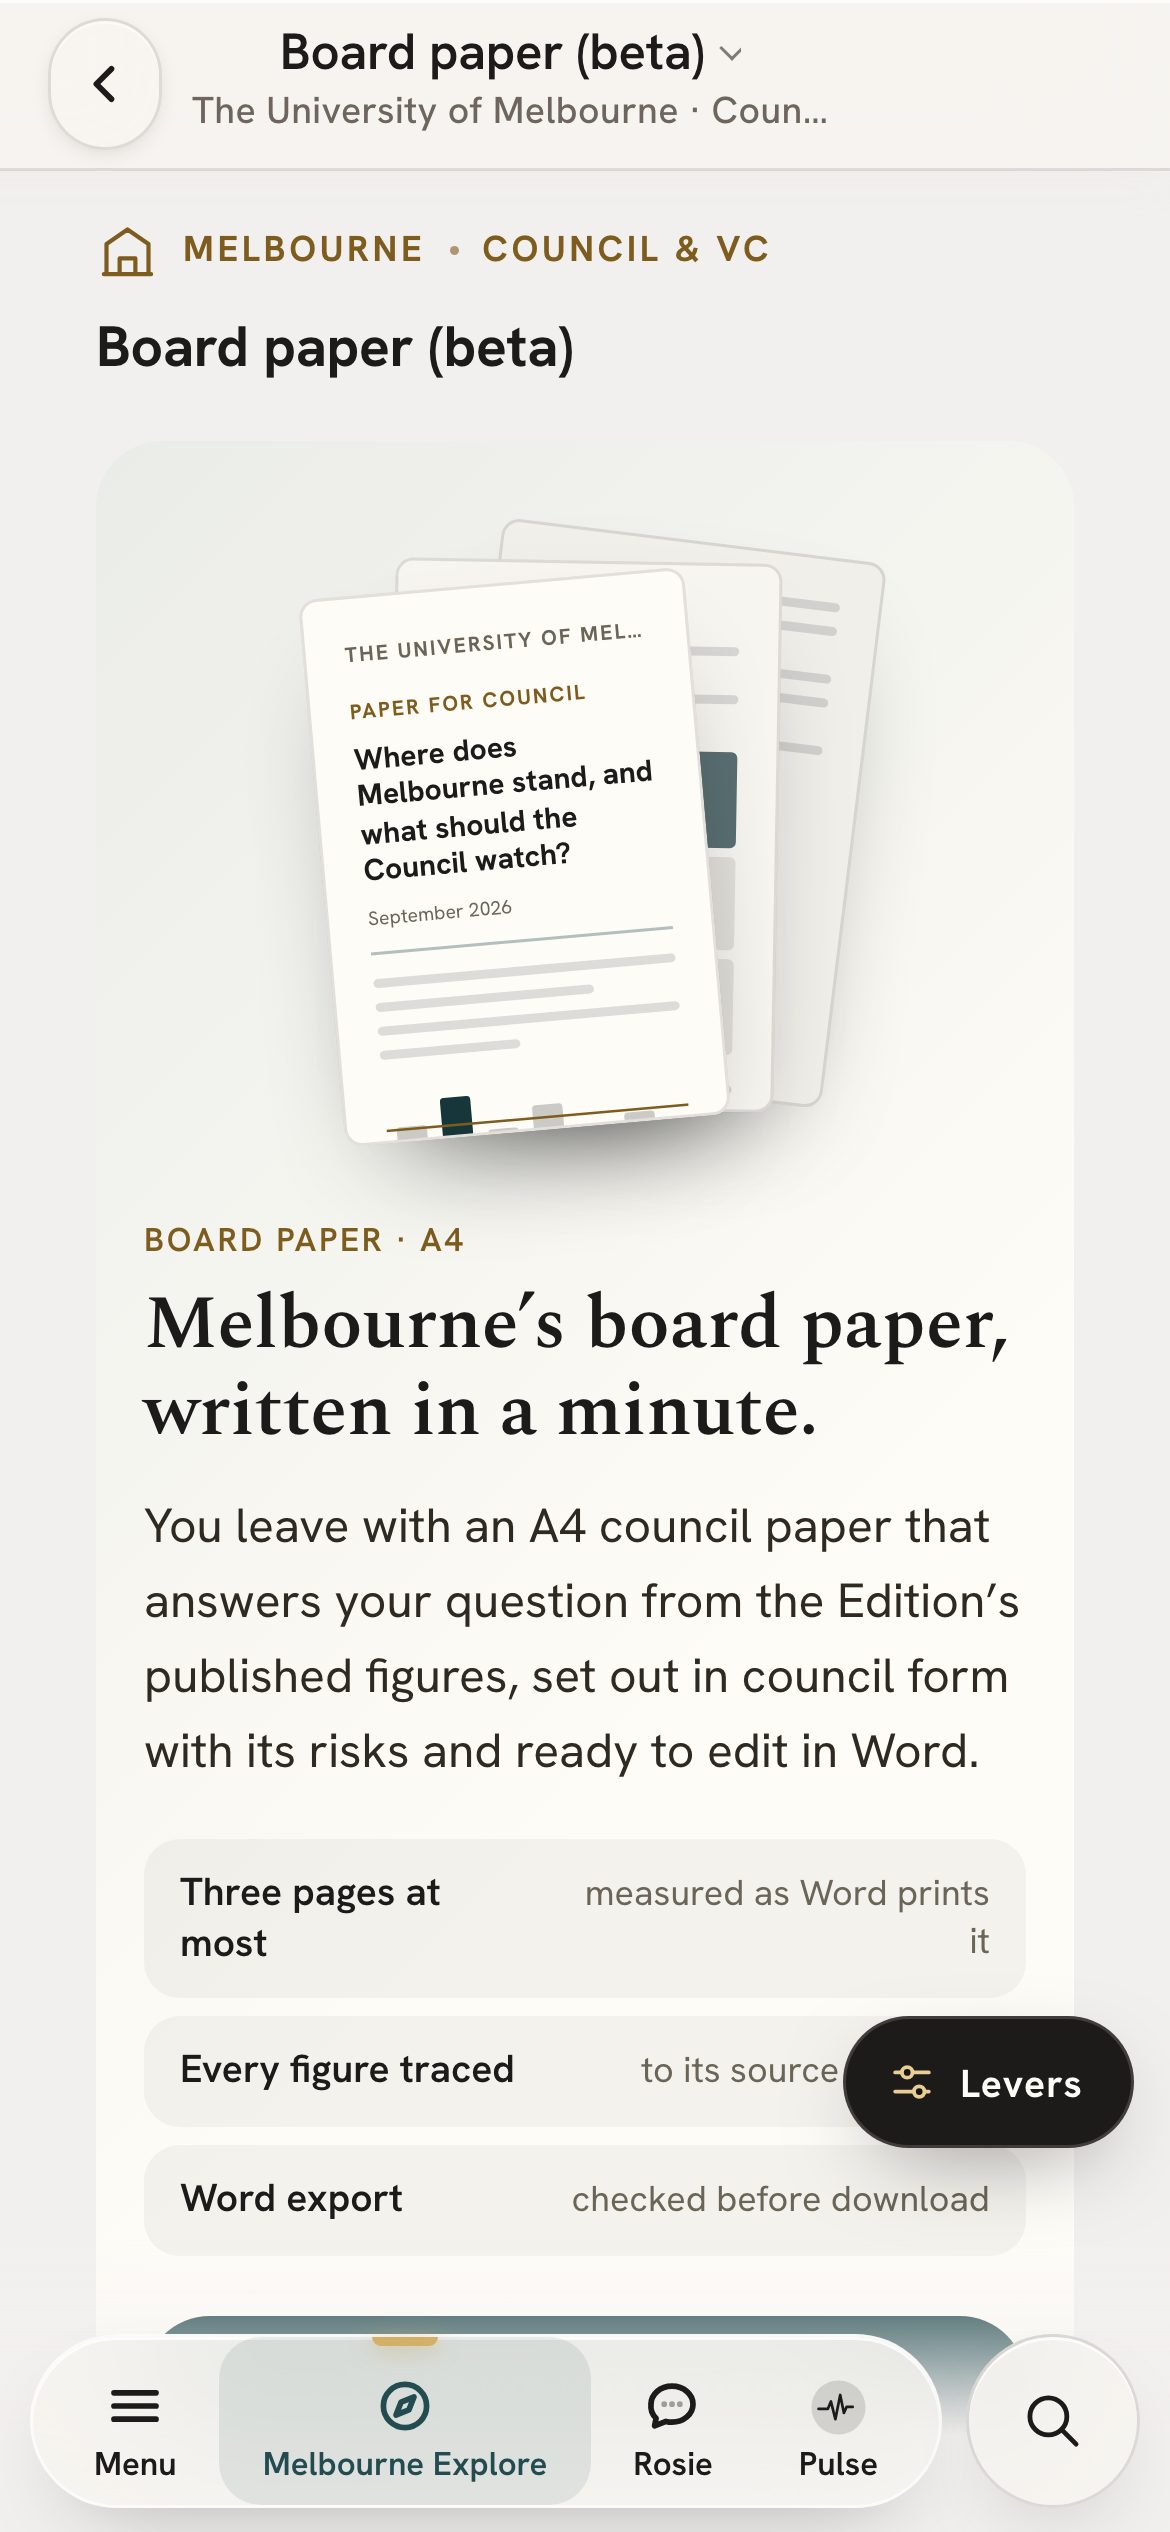
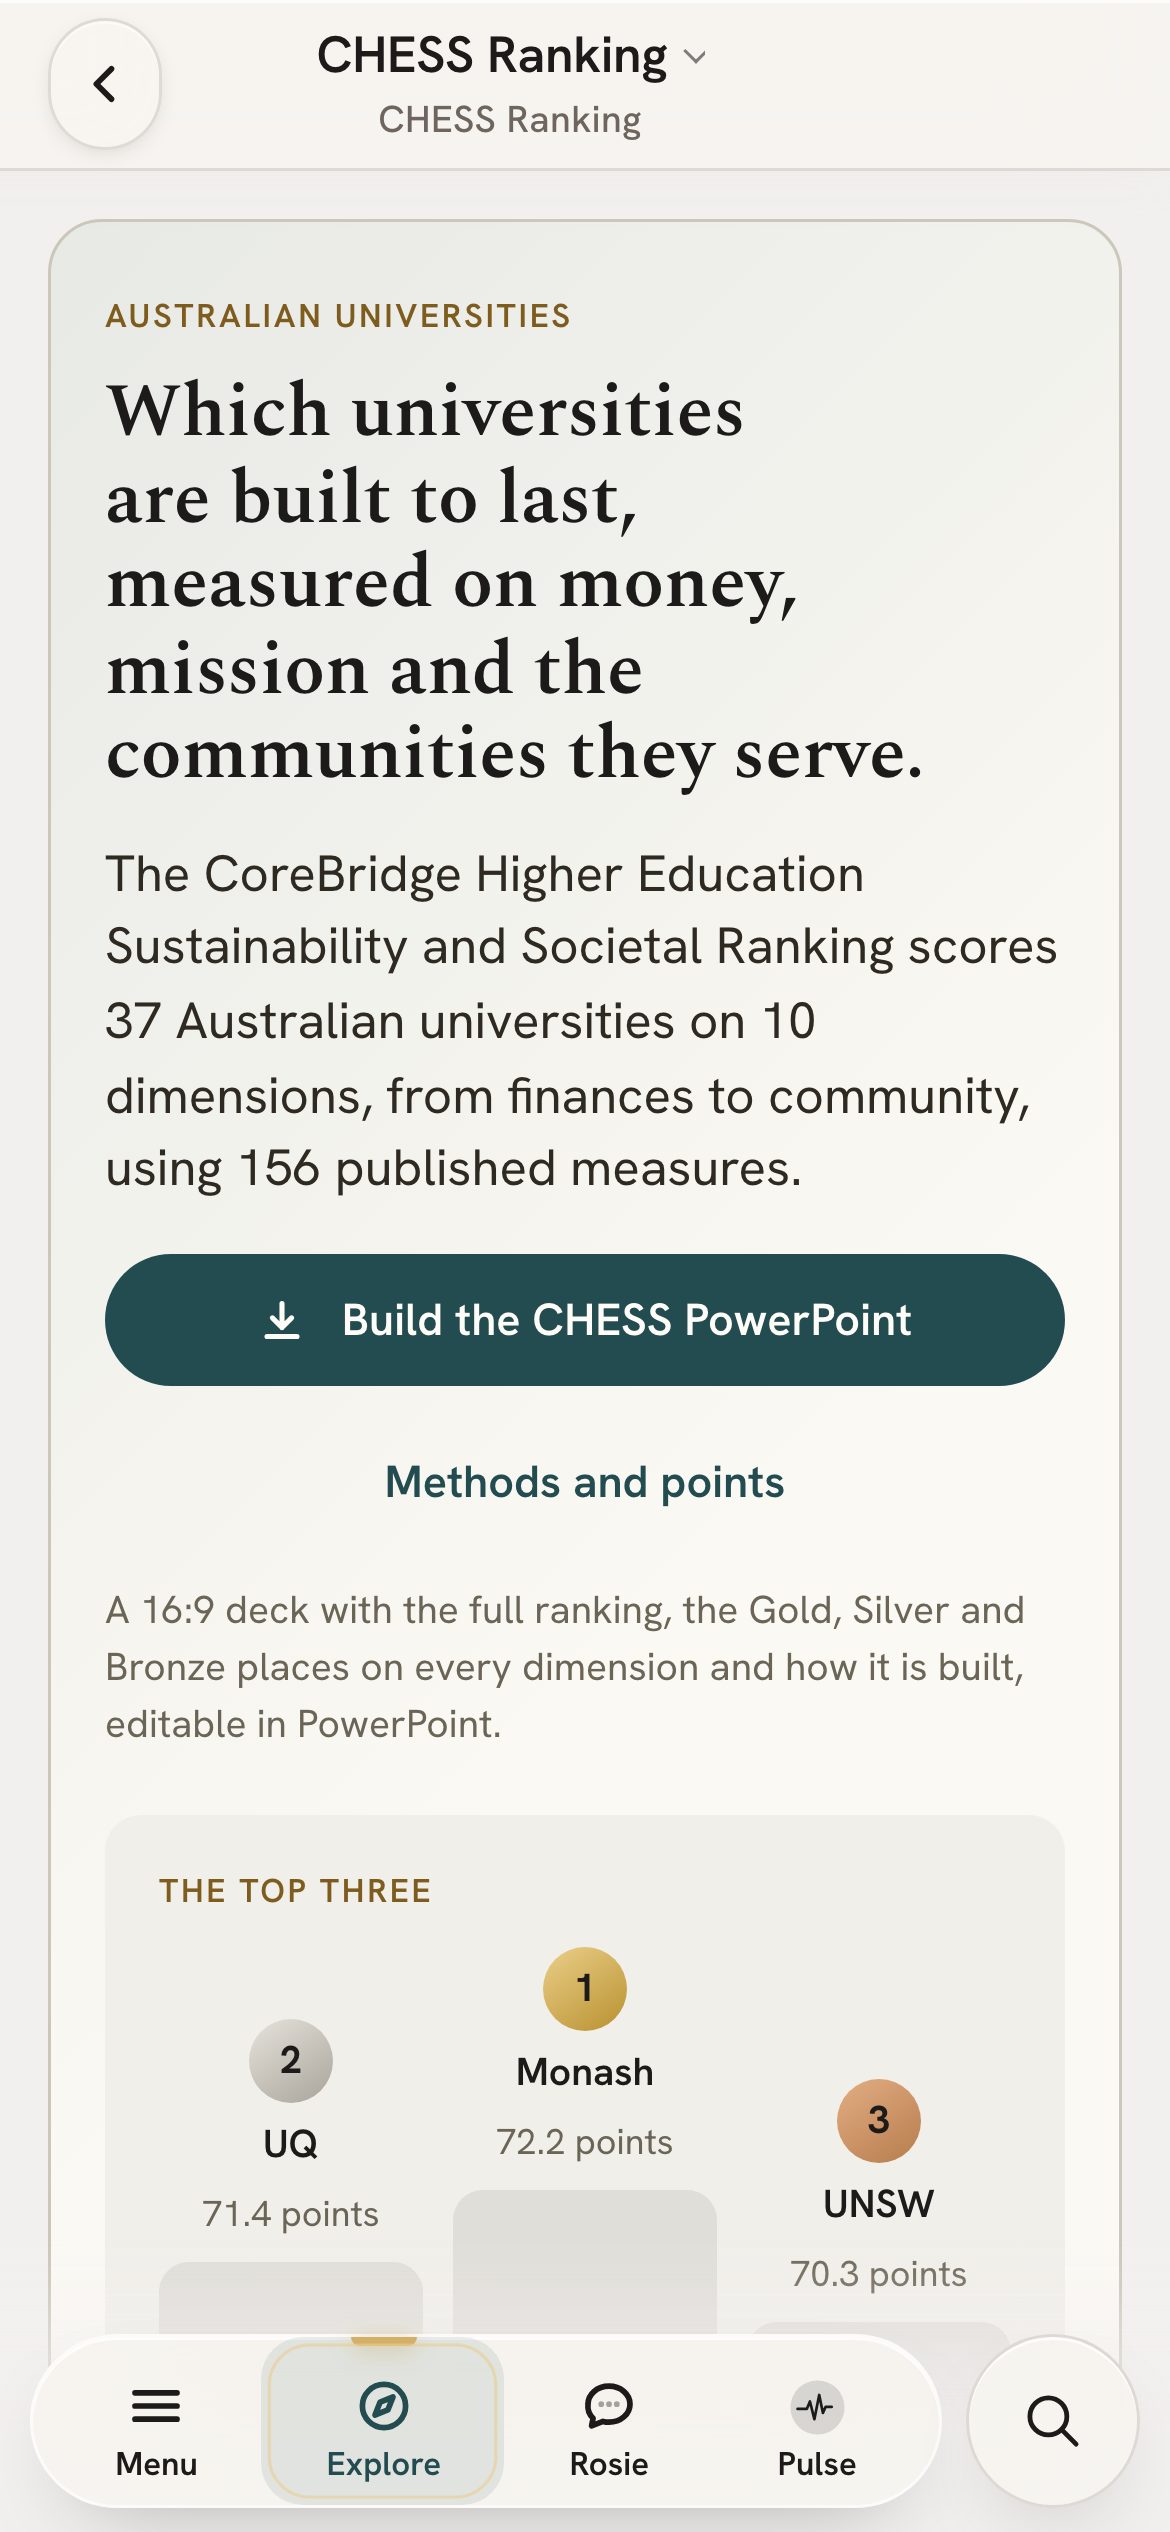
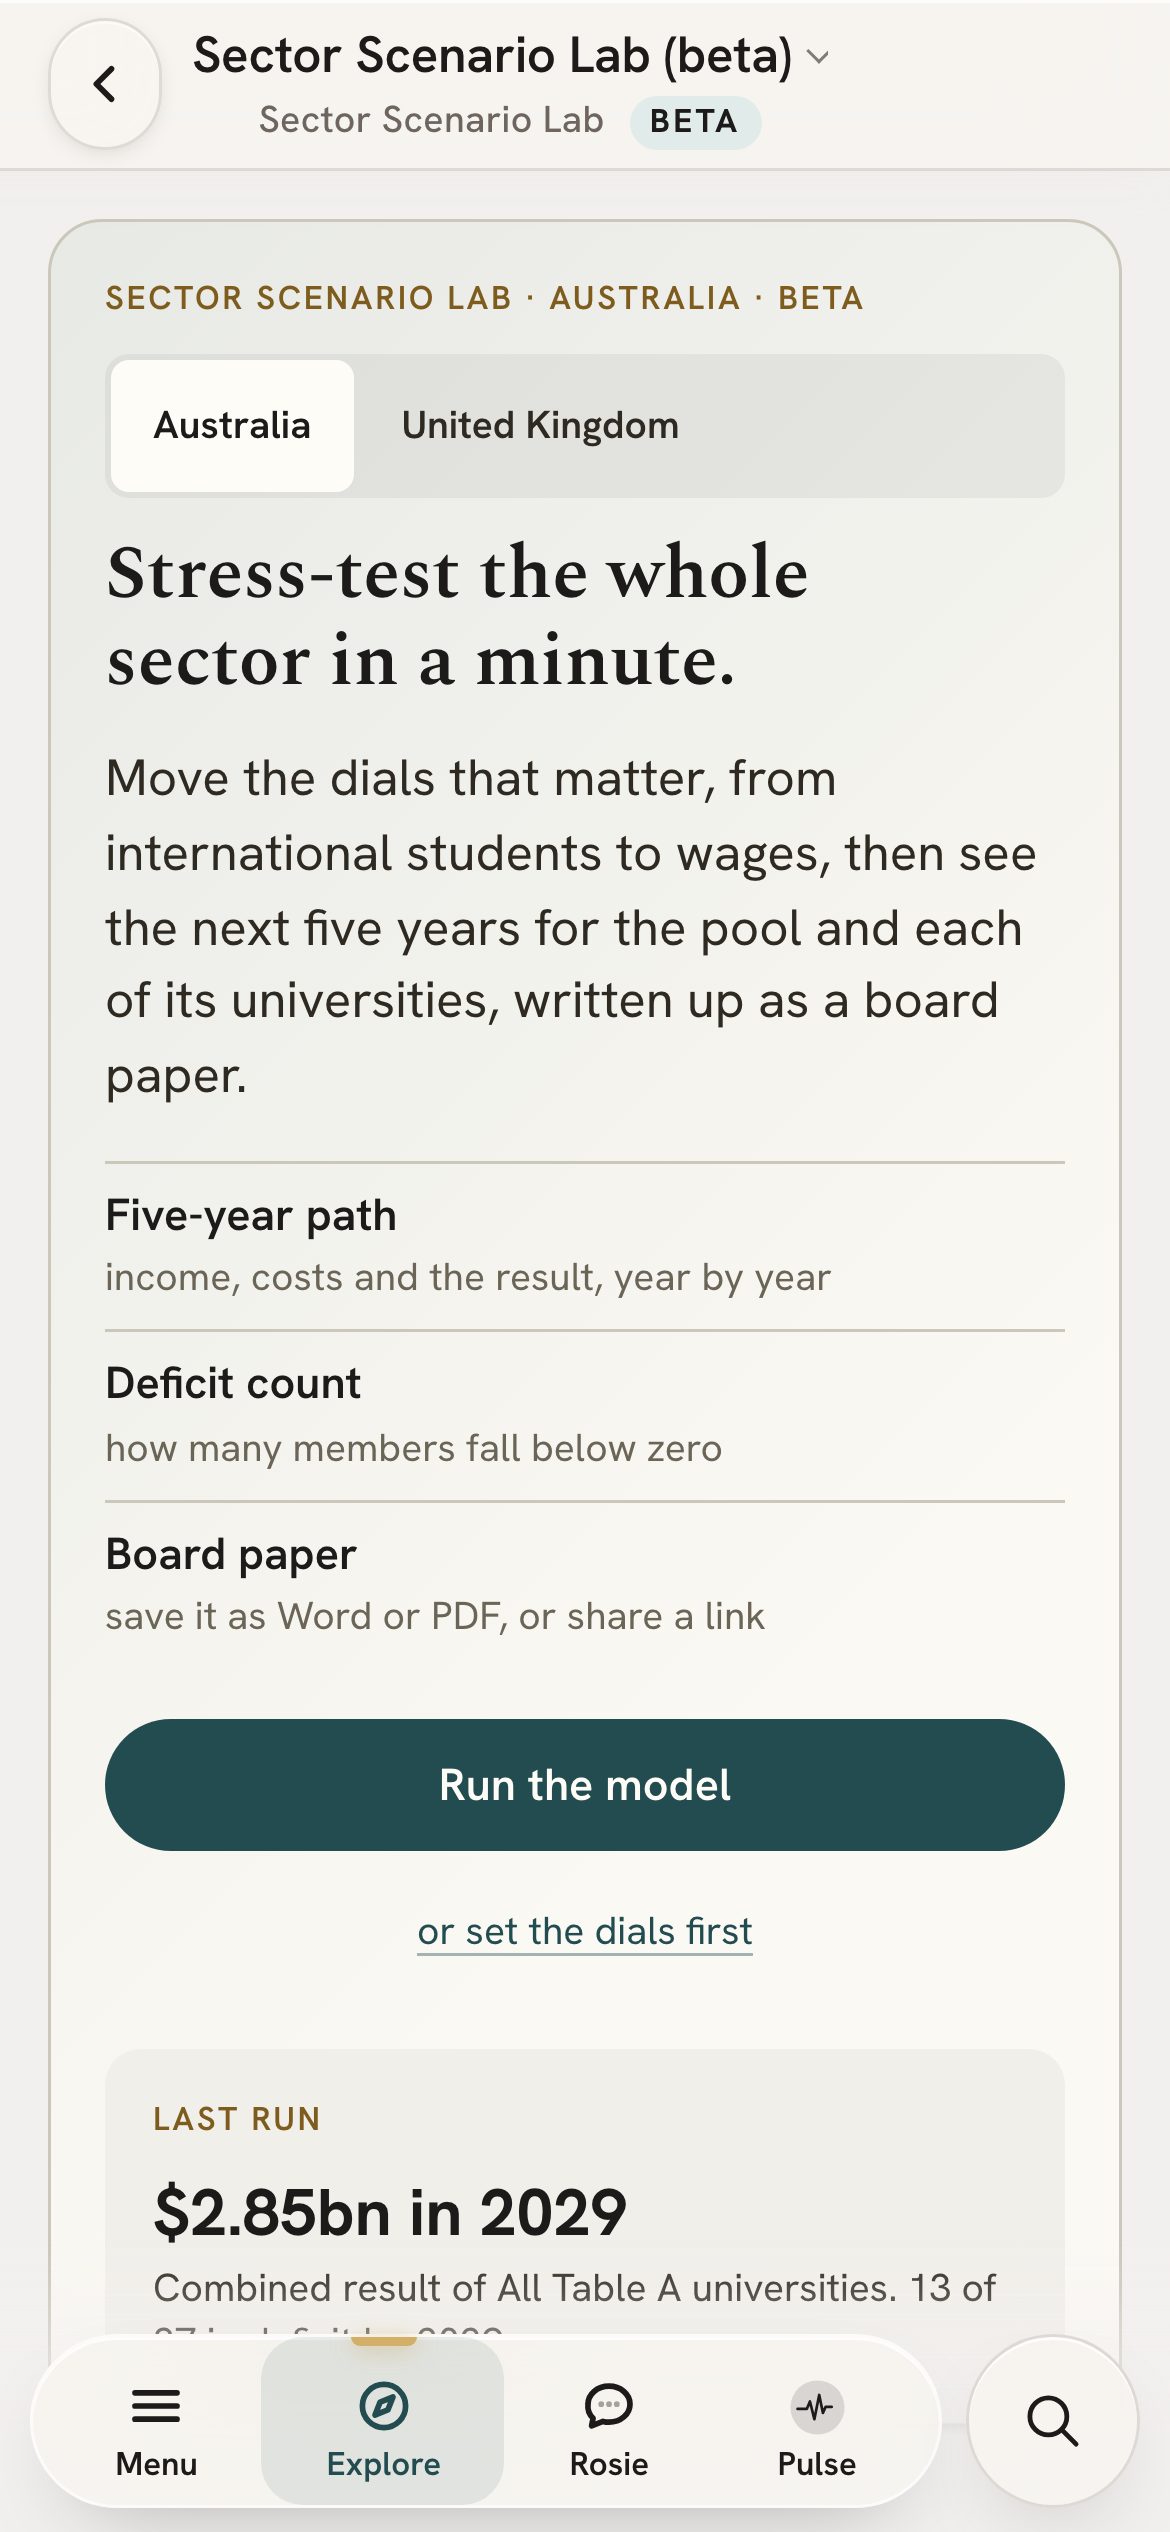
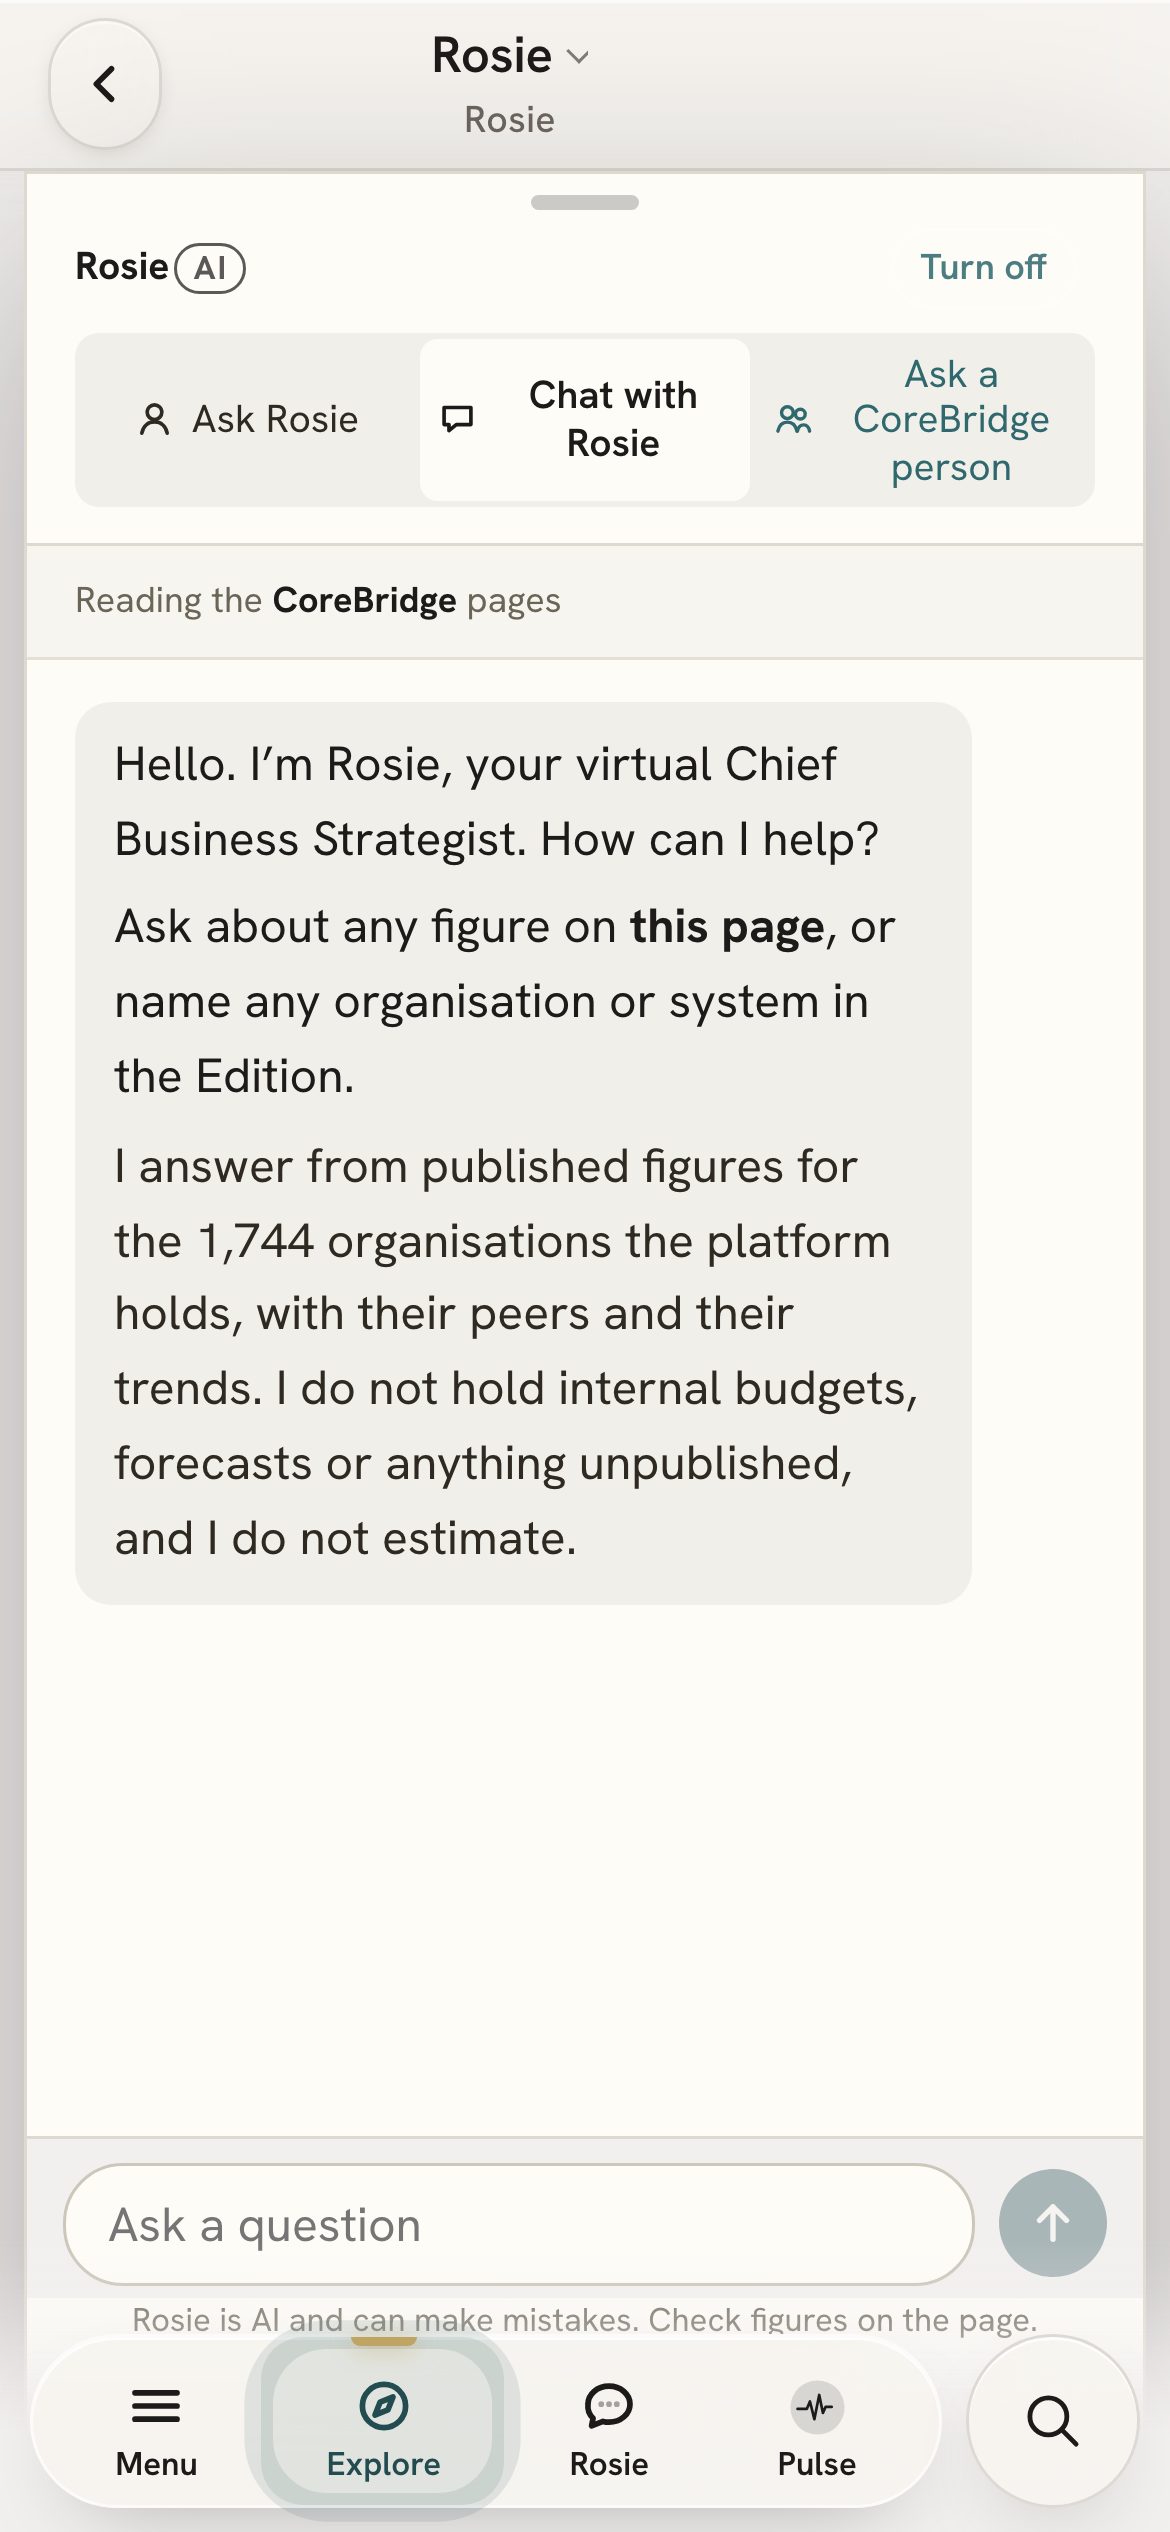
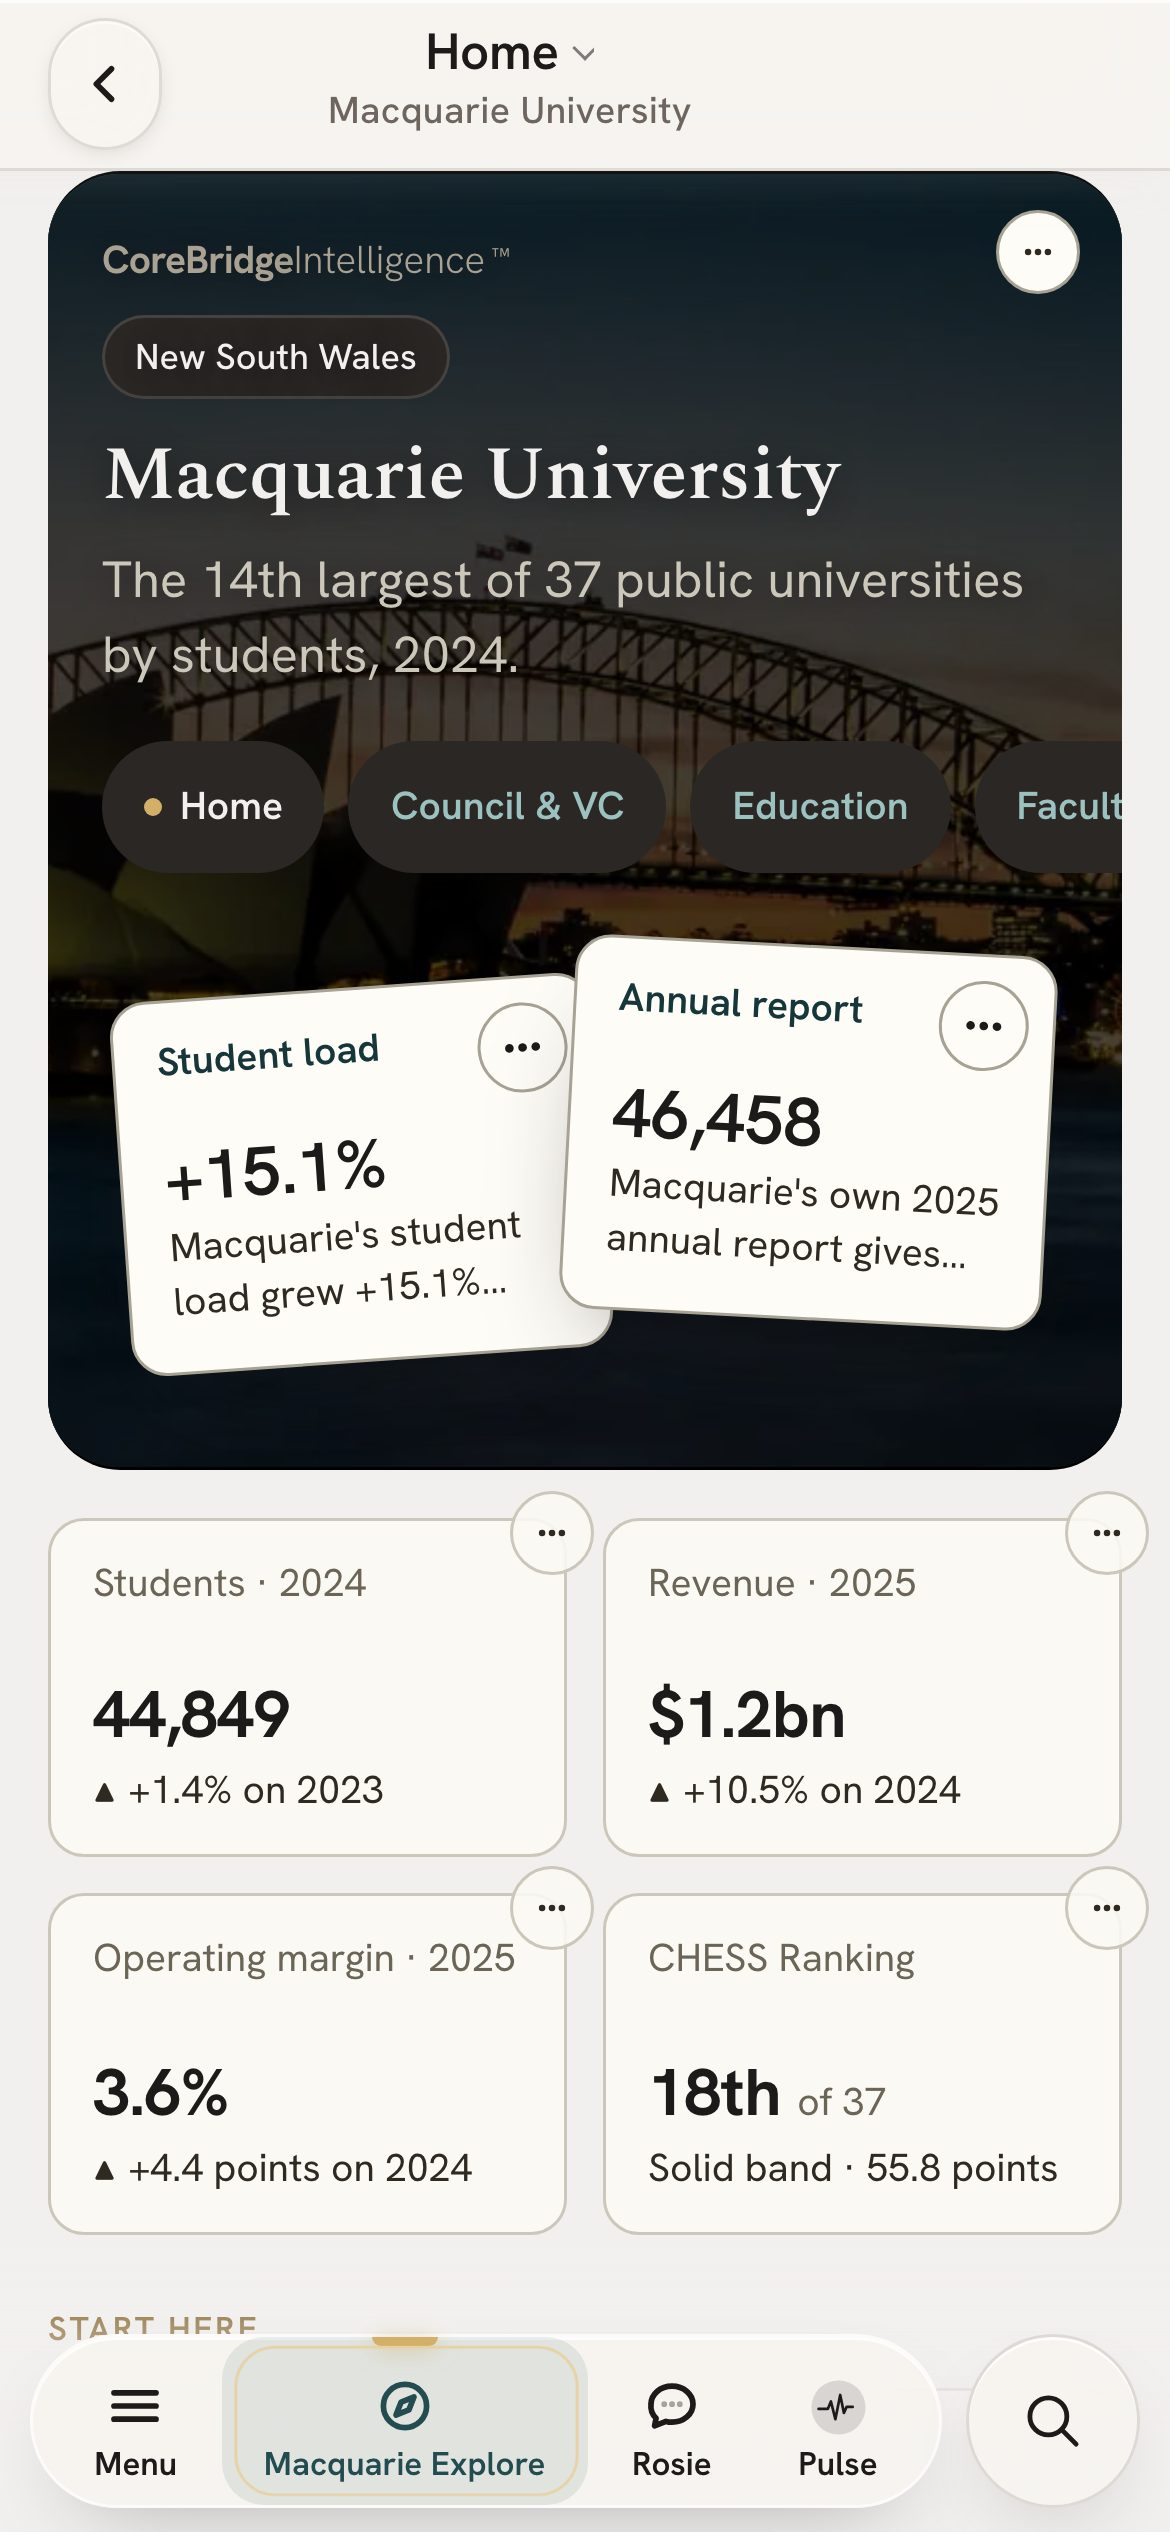
The Executive Edition, showing published figures for a range of Australian universities. The universities shown are examples, not customers.
Evidence for the decisions on your agenda.
Compare
Understand your position. Compare institutions, faculties and relevant measures over time.
How comparison worksInvestigate
Examine markets and opportunities. Explore student demand, research funding, employment trends and partnerships.
What you can investigateModel
Test the implications. Examine how changes in funding, enrolments, costs and other assumptions affect a scenario.
How scenarios workPrepare
Develop the recommendation. Bring evidence and modelled results into editable papers and briefings for review.
How briefings work
Three levels of analysis, one platform.
Breadth across markets and systems. Depth inside each institution. The same sources and definitions at every level.
National and international
Examine education systems, research funding, student markets and future workforce demand.
Institutional
Compare performance, financial position and strategic priorities across relevant peers.
Faculty and portfolio
Investigate teaching, research, industry partnerships, people, operations and risk.

Every figure carries its source.
Source and reporting period shown with each figure.
Where systems differ, we say so.
Definitions and comparison limits set out where systems differ.
Reported stays apart from modelled.
Reported figures kept apart from calculated and modelled results.
Start free. Go further with the Executive Edition.
The free dashboards need no sign-in. The Executive Edition goes deeper, with scenarios and editable briefings.
Free
Australia
Every university.
ExploreFree
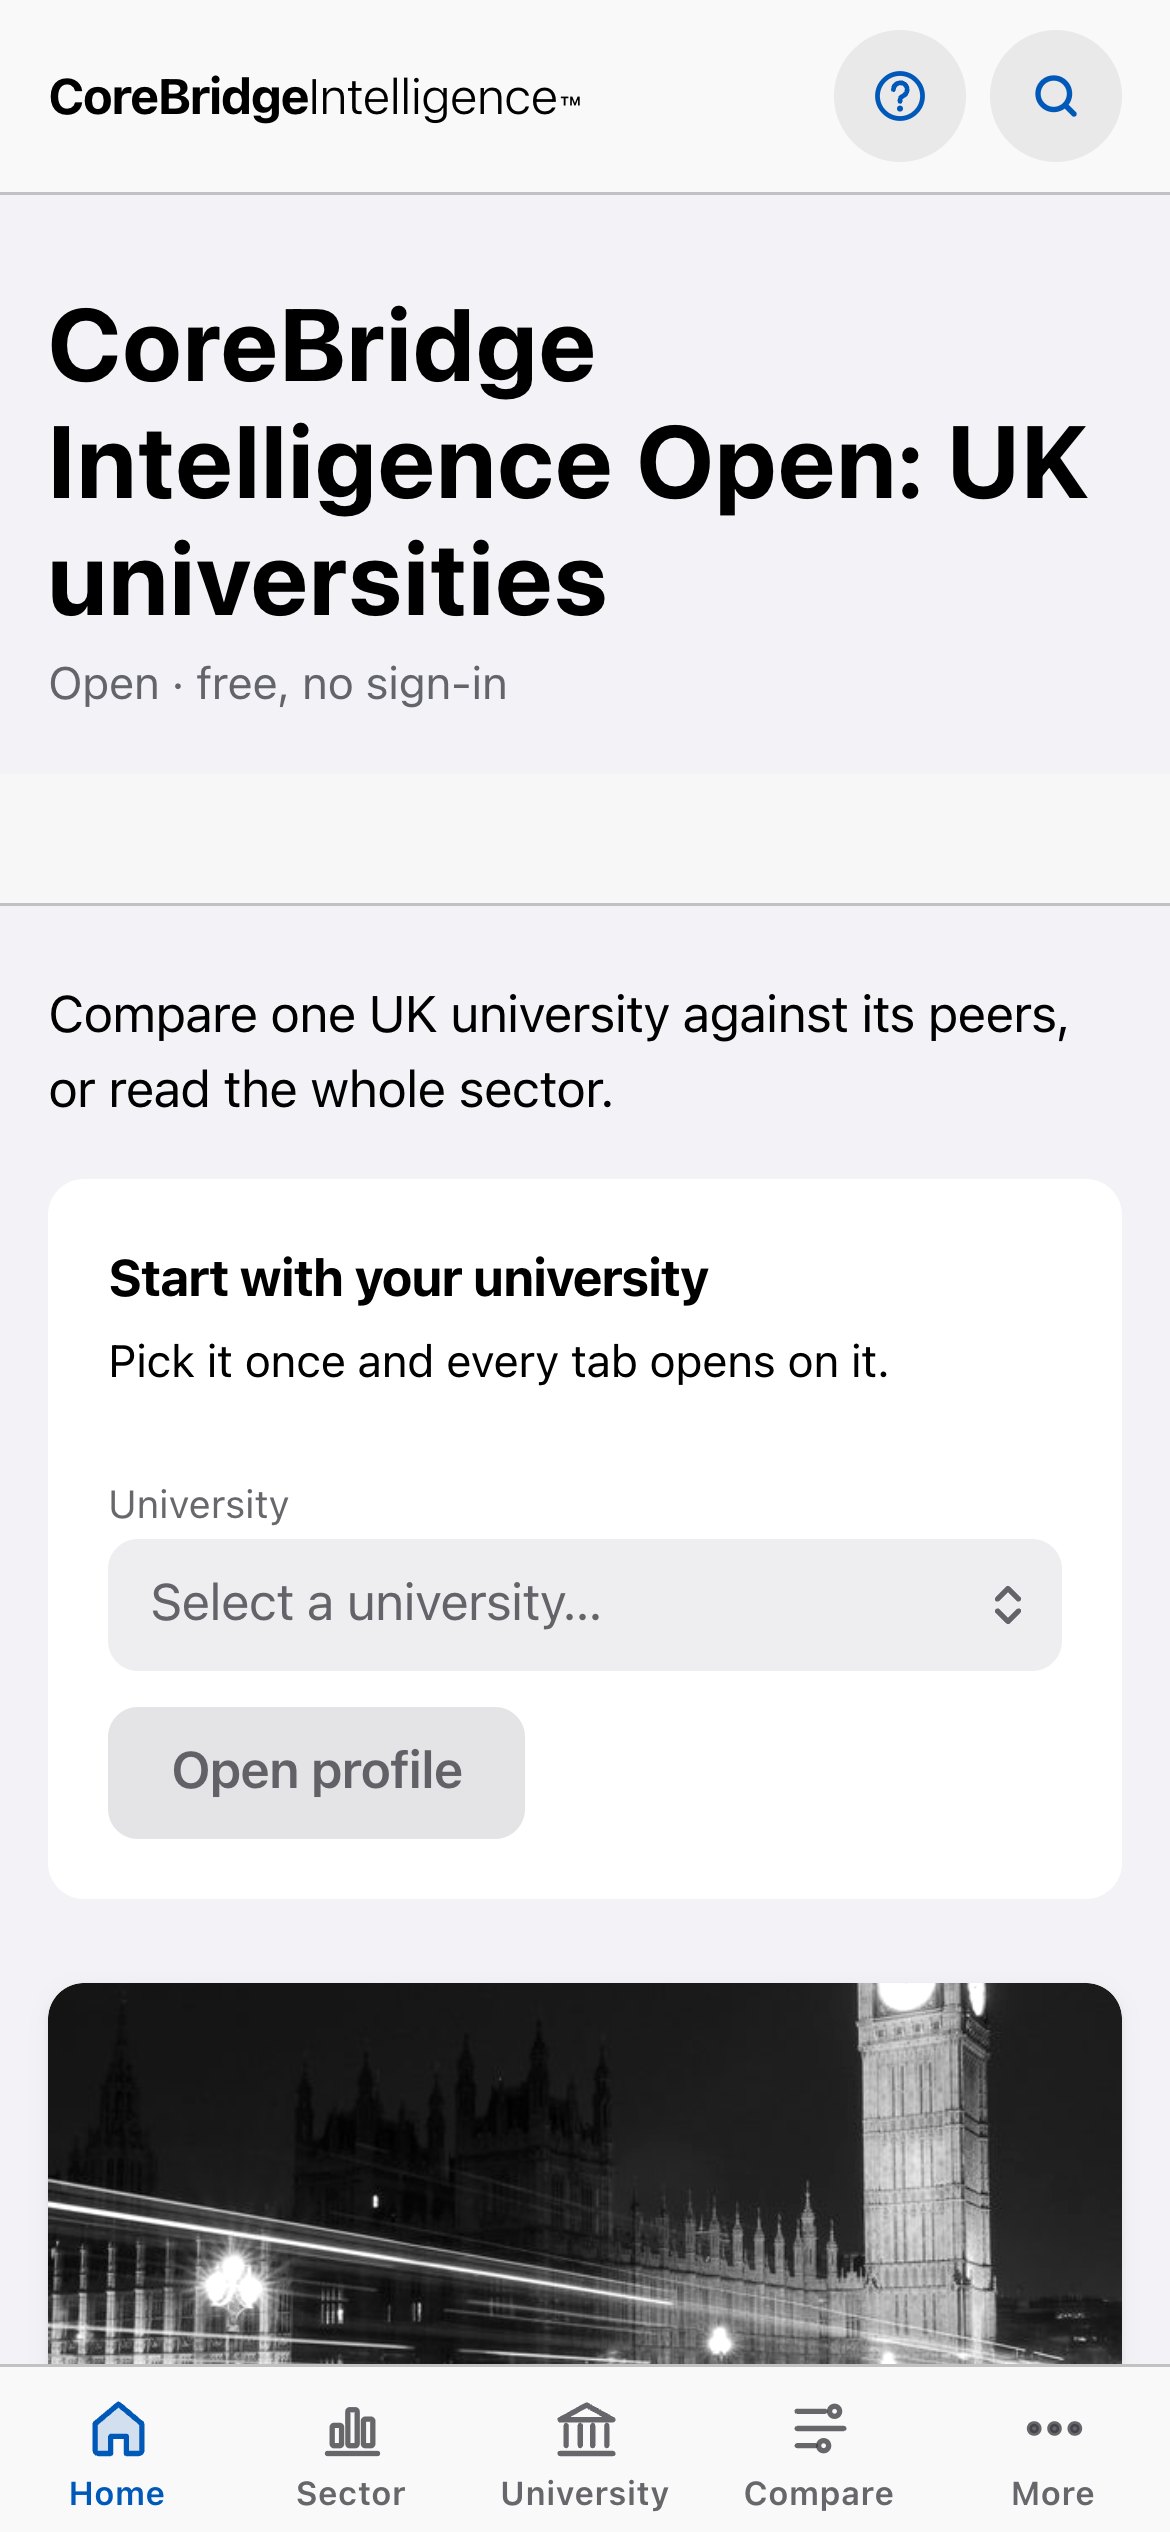
United Kingdom
Every university.
ExploreFree
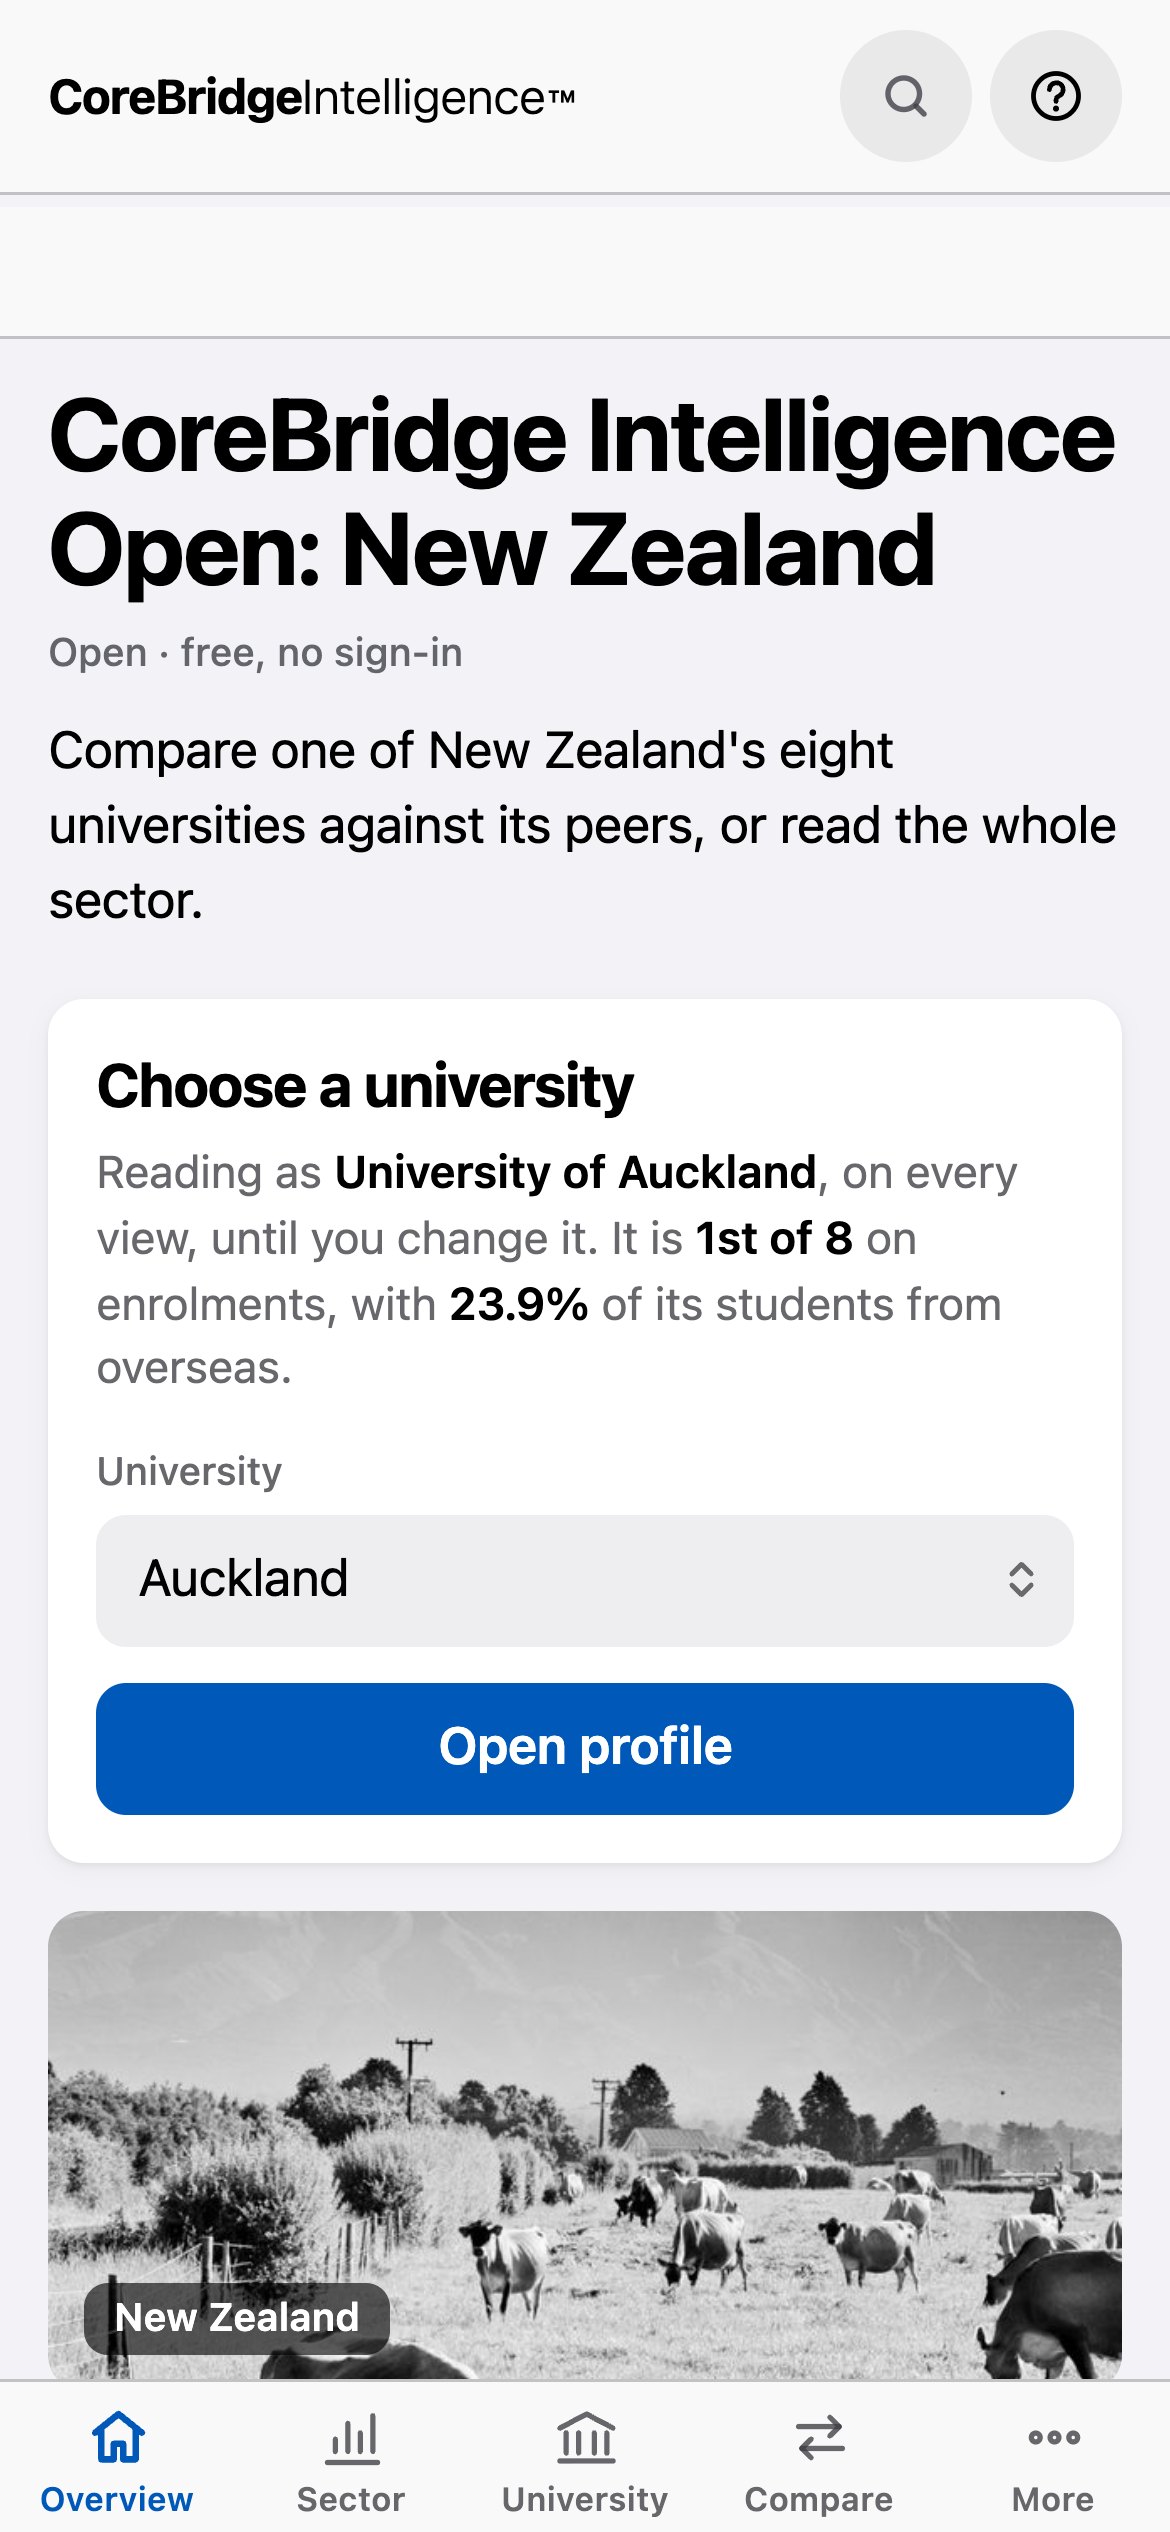
New Zealand
Every university.
ExploreFree
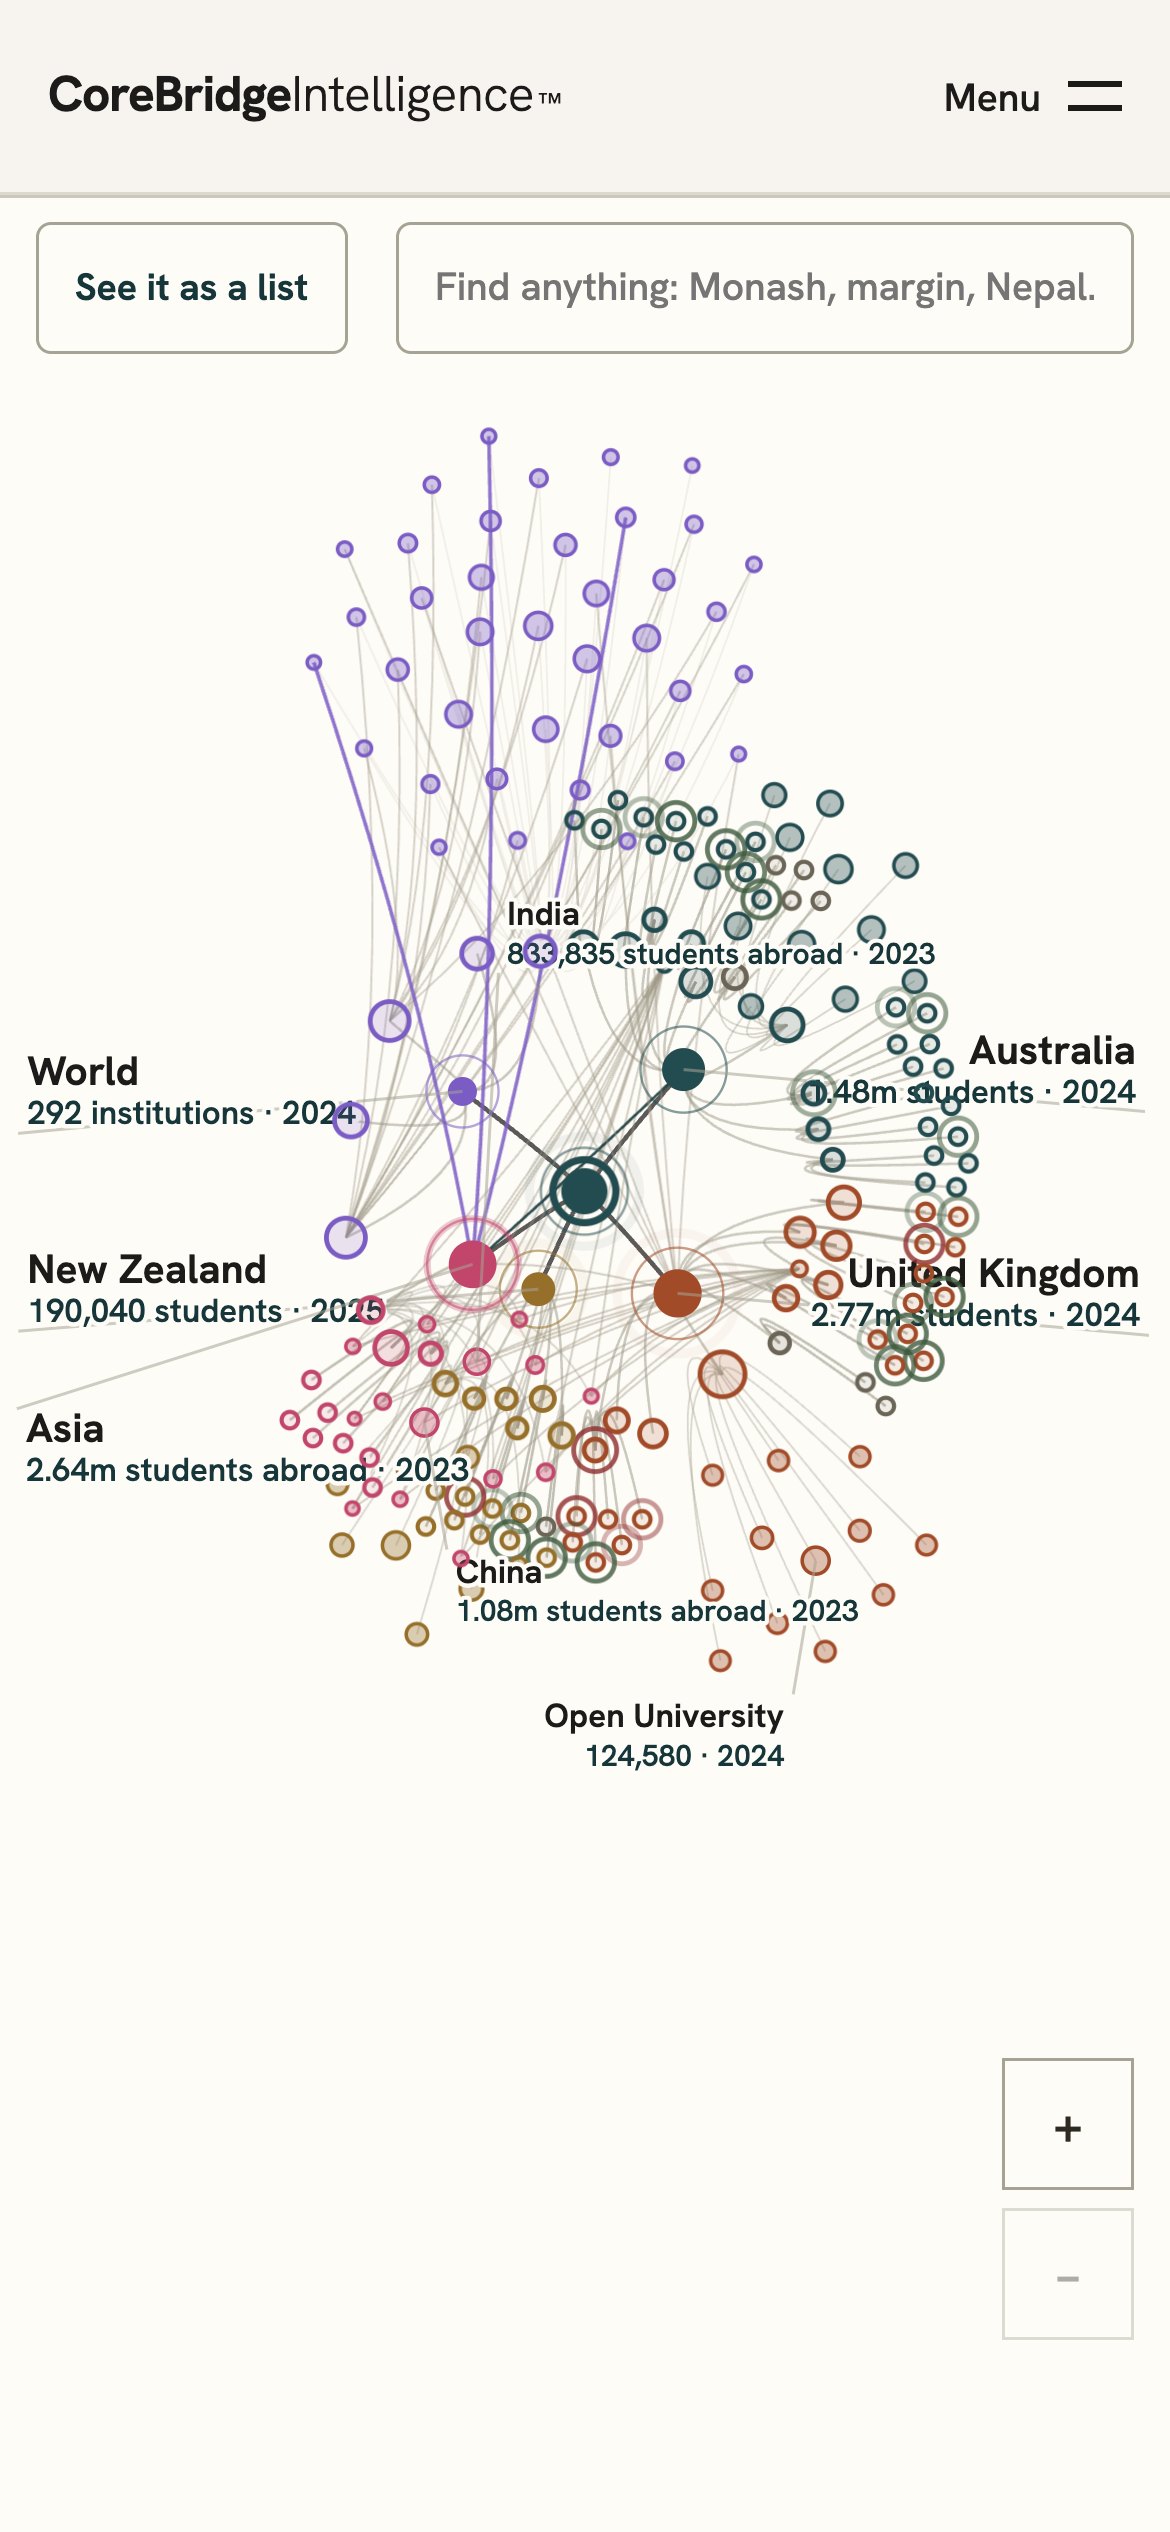
Knowledge Map
Universities and student flows, on one map.
Explore
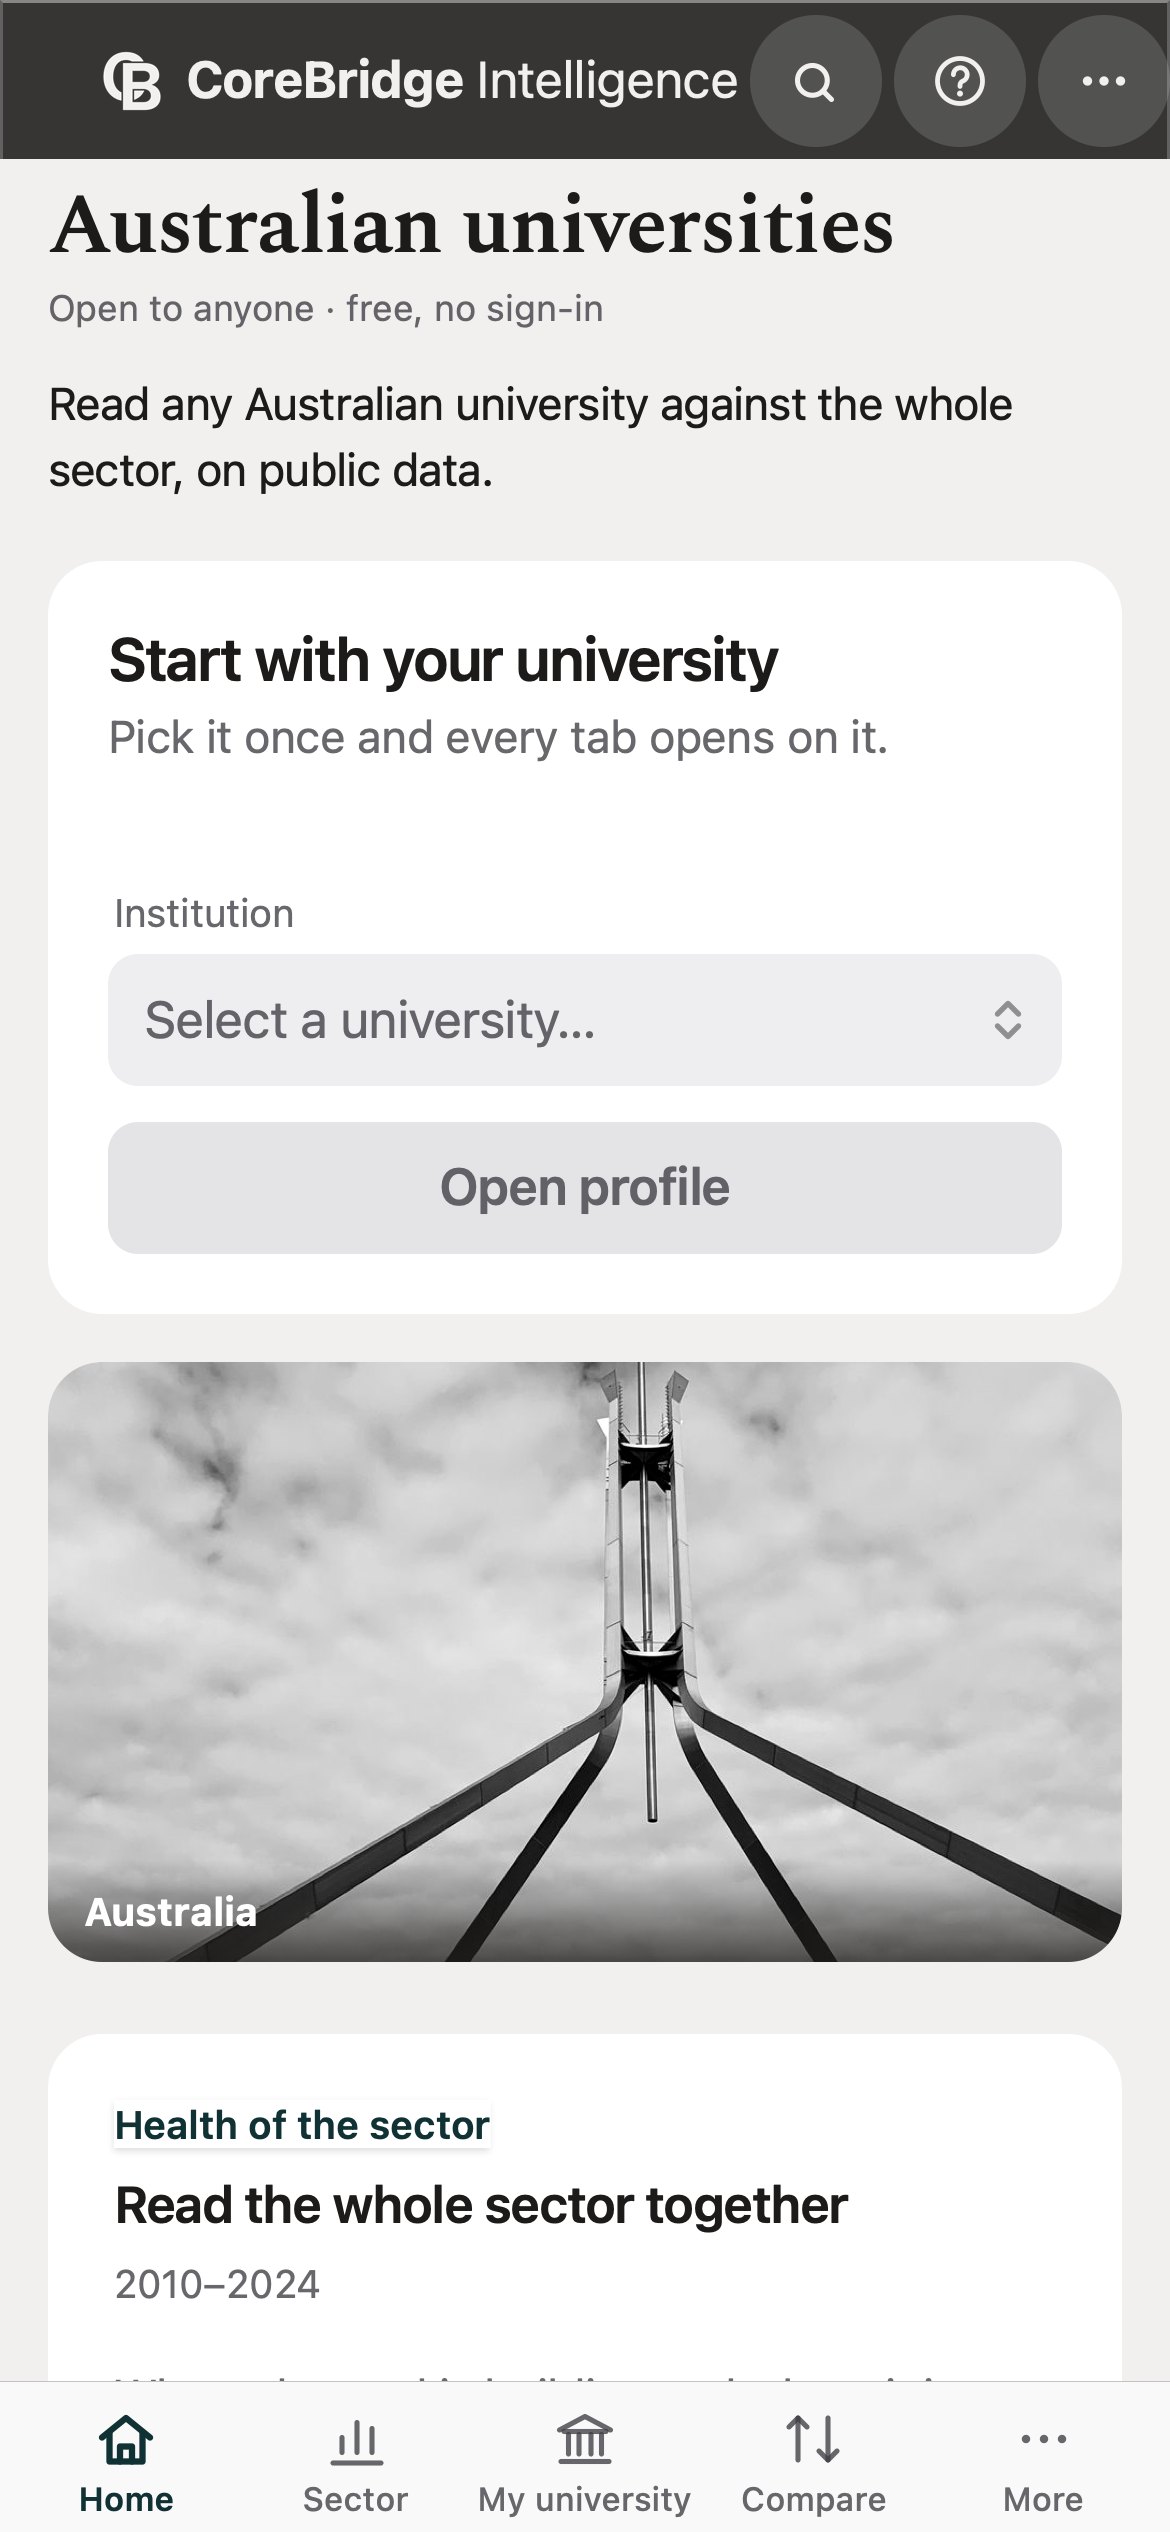
The Executive Edition
Scenarios, peers in other systems and briefings you can edit.
International evidence now. Full country editions by date.
The Edition already holds peers in the United Kingdom, New Zealand, the United States, Canada, Europe and Türkiye, market overviews for Hong Kong, Singapore and South Africa, and the international student source markets. A full country edition reads each of that country’s institutions at the depth Australia has today. Australia is open now; the United Kingdom follows at the end of 2026; Canada, New Zealand and the United States in 2027.
- Open nowAustralia, full edition
- End of 2026United Kingdom, full edition
- 2027Canada, New Zealand and the United States, full editions
Request a demonstration
Bring a question from your next meeting.
Request a demonstration shaped around your institution, portfolio or policy question. We will show you the relevant evidence, explain the coverage and explore how your team could use it.